Last week I ended with the punchline that, despite persistently negative headlines reaching me through the conventional media channels, the nowcasters at the Federal Reserve Bank of Atlanta saw the most recent news as positive. They:
ran it through their quantitative tools and figured it meant the fourth-quarter Gross Domestic Product was on track to grow a bit faster than they had thought a few days earlier. Those data nudged the nowcast up from 11.0 to 11.1% annual rate of growth. Then again on Friday, after digesting the weekly unemployment claims news and the (un)employment situation report that morning, GDPNow updated again to show another nudge up another notch to 11.2% Q4 growth.
This week I start with the same way of gauging how we're doing. It's the very most current/immediate of all economic indicators, as Atlanta's GDPNow people meet once or twice a week to consider the effect of same morning's breaking news on the current quarter's growth path. In the week of Dec 7-11 they met only once, on Wednesday, and here's the full text of their update [emphasis in original]:
The GDPNow model estimate for real GDP growth (seasonally adjusted annual rate) in the fourth quarter of 2020 is 11.2 percent on December 9, unchanged from December 4 after rounding. After this morning’s wholesale trade report from the U.S. Census Bureau, the nowcast of the contribution of inventory investment to real GDP growth decreased from 4.80 percentage points to 4.79 percentage points.
So, no change from Dec 4 through 9, but the current estimate of 11.2% does represent a huge brightening from their first Oct 30 estimate of 2.2% annual rate of growth for the fourth quarter.
The second-most current and broad-based view available of how we're doing is the New York Fed's Weekly Economic Index (WEI) that I've been starting these newsletters with for the last month+. Although the 10 daily and weekly data points that go into the composite index are necessarily highly timely, I haven't noted often enough that the index does appear with a one-week lag. Hence, here on Dec 13 I'm writing about the week ended Dec 5. Still, these numbers are much more up-to-date than the typical monthly data point that comes out in Dec telling us what was going on 4-7 weeks earlier in Nov, for example.
With all that grounding, here's what the first days of Dec were telling us:
The accompanying commentary, in full:
The decline in the WEI for the week of December 5 is due to a decrease in fuel sales, which more than offset a decrease in initial unemployment insurance claims (relative to the same time last year) and rises in tax withholding, electricity output, and rail traffic.
The good news is that since I wrote last weekend, the number that had been reported as -2.31 was revised upward in the graph above to -2.08; that is, the drop you see in the latest week to -2.39 leaves us only barely below what we thought the previous week's point had been. The NY Fed cited four areas of improvement/optimism, but that was more than offset by a big decrease an indicator I've never followed nor heard any public discussion about: fuel sales data from the U.S. Energy Information Administration.
Because the WEIndex's fuel sales component involves the NY Fed conducting their own calculations based on underlying data on gasoline, diesel, and jet fuel sales to retailers and end users in a process that is opaque to me, I can't delve further into the meaning of the decrease (i.e., whether it maybe stems from seasonal factors or some other anomaly). I can note that the downward deviation from the upward trend in WEI is smaller than two other drops that we saw in July and in September—for now. I'll continue to track this index carefully every week for early signs of sifts in the growth trend.
The second week of the month is generally the slowest for economics news, and that's definitely true this time. The main monthly indicator was Friday's release of the University of Michigan's survey of consumer sentiment, which consists mostly of just three numbers: the overall index, current conditions, and expectations for the next five years. They are index numbers, meaning that their numerical values have no inherent meaning; we can only compare the newest value to previous values to see the trends.
Coverage was sparse in the usual media channels: CNBC.com, for example, seems to have nothing at all on this normally rather high-profile bit of economic news. I certainly didn't see it on the evening news. Even UMich's own website seems to be out of date, and is very unhelpful even when it is not. What was the news?
I happen to have Saturday's Wall Street Journal print edition (because it included the Books of the Year 2020 insert). So I was able to find on p. A3 "Consumers Expect Economy To Improve as Pandemic Fades."
The University of Michigan said Friday its index of consumer sentiment climbed to 81.4 in the two weeks ended Dec. 9, from 76.9 in November. Economists surveyed by The Wall Street Journal expected a reading of 75.5.
Rosier expectations for the economy drove the index's rebound, though respondents' views on current economic conditions improved as well.
A partisan skew in views was responsible for much of the upward shift in sentiment, with Democrats becoming more optimistic about the economy and Republicans more pessimistic.
I noted in previous newsletters the same partisan split, which to me casts doubt on the validity of the data; and the Journal adds that this partisan shading to the Michigan numbers have "long been" the case.
With the caveat about the Michigan data being skewed by politics, we'll take the good news, especially given that it's a leading indicator that bodes well as we move into a new year.
Another consumer-based survey, which is also another NY Fed-sourced report, comes out tomorrow Dec 14. It's the Survey of Consumer Expectations. I wrote about it two months ago, and I expect go deep into the newest data next weekend. Contrary to UMich, it's very full of fascinating subcomponents with lots of graphs good for pasting and interpreting. It will be highly illuminating to find out what consumers are saying in this survey.
One other indicator worth discussing is one that is not on the normal calendars of such things, but which gets the attention of many economic observers. I speak of the Main Street Health report from the company Homebase. Homebase provides various services to small businesses and gathers information from them. The information is not meant to be reflective of the entire macroeconomy, but specifically of the mom-and-pops. We see lots of anecdotal reports on the news about they typical restaurant down the block, but this is the only report I know that attempts rigorously to quantify this sometimes hard-to-gauge sector. When I wrote about Homebase four weeks ago (under the sub-headline that included "'lockdowns' threaten the coming weeks/months"), I stressed that:
virtually nothing else in the past two months has vindicated the Homebase view of flatlining since July: not the government's employment and unemployment stats (nor ADP's private-sector employment stats), not factory orders and various purchasing managers' indices, not surveys of consumers, not retail sales, not GDP itself, and not the small business survey … .
The reason is what I just said: the other surveys and data dumps are, or try to be, measuring the entire economy, while Homebase focuses on the types of businesses most likely to be deemed "non-essential" by arbitrary COVID-shutdown decrees from governors or mayors. We've seen every week in these newsletters that the economy at large has been growing steadily since May, and Homebase tells us the mom-and-pops had been—as of four weeks ago—flatlining since July. (All of that indicates that the larger parts of the economy typified by Amazon.com and 'big box' stores have been doing even better than "growing steadily." But you already know that by looking at the crowds you see in Wal-Mart, Home Depot, etc., and at such big firms' stock prices.)
So, what has Homebase found lately about Main Street shops? Their latest report came out December 3, summarized by these three paragraphs [emphasis in original]:
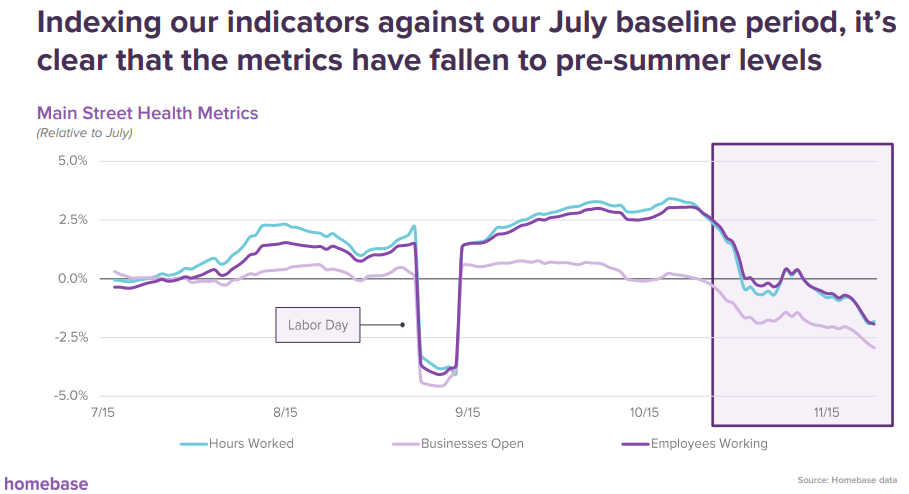
In November, our businesses open metric declined noticeably, along with our two other economic indicators of hours worked and number of employees working, ending a period of stagnation and initiating a clear decline across metrics.
While seasonality plays a role in this decline, COVID-19 continues to adversely impact small businesses, as seen in states and regions that concurrently saw both larger spikes in COVID cases in November and steeper declines in metrics.
As COVID cases continue to climb across the nation, we expect conditions to worsen, placing increased pressure on Main Street as small businesses continue to struggle to survive in the current environment.
Here is their principal set of graphs:
If I were teaching in school, I would use these graphs above to illustrate "How to Lie with Statistics," to borrow the title of the famous 1954 book. I'm not saying Homebase is literally lying in any sense—just that the choice of the bottom end of a vertical scale greatly influences viewers' perceptions of graphed data. To wit, the Mar - Nov graph on the left minimizes the extent of November's decline (making it look less 'markèd') while the Sep - Nov graph on the right maximizes it (making it look more 'markèd').
But either way you visualize it and have your impressions swayed by the choice of visuals, something is going on here. Homebase graphs the same data again over a third interval, using July as the 0.0% baseline, revealing this:
They add that "The slowdown is nationwide, with almost every single state experiencing a decline in November" in terms of the business-open measure. The one exception is Hawaii, which saw the "smallest increase in number of COVID cases of the 50 states from 10/23 to 11/23." Among the Lower 48, the single best-off state is Kansas, with a fractional decrease in businesses open; and the single worst is New Mexico, where closures numbered about 14% relative to July. The other states worse than -7% from July to the Oct-Nov period are Oregon, Michigan, Delaware, and Minnesota.
The worsening in businesses open among the smallest "Main Street" companies [again comparing Oct 23-Nov 23 to a July baseline] was also spread across all 13 of the industry classifications that Homebase now uses. The worst off is Entertainment, with 9.2% more closures than in July. I had thought, at least around here in Western Massachusetts, that every entertainment venue was thoroughly shut before July, and has stayed that way continuously through the present. But nationwide, some of them must have been open in July, and closed recently. The other 12 industries are also more closed in Oct/Nov than in July by amounts that range from -0.5% for Medical/Veterinary to -6.0% for Education (which must be things like strip-mall tutoring places).
To close I'll excerpt a bit from John Mauldin's latest newsletter Thoughts from the Frontline. His Dec 11 issue, "Survival of the Biggest," centers on the same K-shaped divergence that I just wrote about:
The virus—or specifically the political response to it—is causing a mass extinction event for small businesses in certain sectors. At the same time, some large businesses are reaping a bonanza of revenue from the same pandemic. …
Small businesses have been disproportionately harmed by haphazard, inconsistent local orders restricting how they operate or sometimes closing them completely. I get the health concerns. The initial closures last spring made sense, given how great the threat looked and how little we knew at the time. We have since learned a lot. Governors and mayors can be more precise and, very important, help small businesses operate safely. Instead, they have often produced the worst of both worlds, harming businesses and workers and still not slowing the virus.
He goes on at considerable length about this, and you may want to read it.
But the part of Mauldin's article that I really wanted to bring to your attention was this:
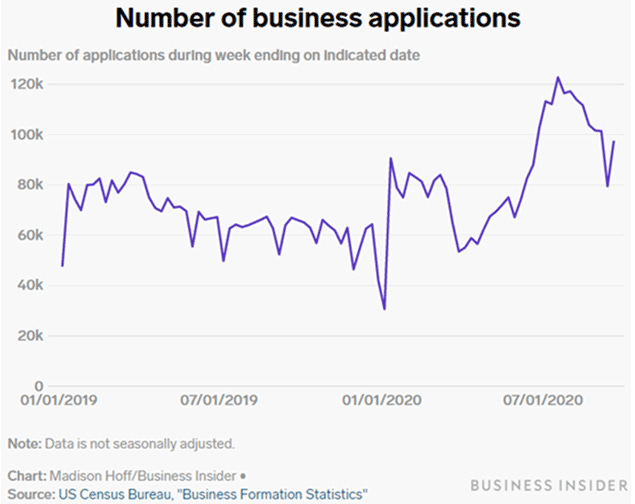
Small Business Startups Are Increasing
Well over 100,000 small businesses failed this year and we could lose many more. But I continue to believe those entrepreneurs have something in their DNA that will get them back on the playing field. We now have data that demonstrates it, too.
Source: Business Insider
Clearly, a significant group of entrepreneurs has decided that now is the time to start out on their own (perhaps again). If you are looking for green shoots, there is no clearer example.
I would never have noticed this important information about the creative part of Joseph Schumpeter's Creative Destruction anywhere else, so I thank Mauldin for the tip. Old businesses closed are easy for us all to see, particularly when they occupied storefronts; new business startups replace some stores visibly but are highly likely to be invisible service-based LLCs or online ventures.
I've instinctively known that right now—when rents or purchase prices on commercial property are surely at rock-bottom lows, and all sorts of fixtures, equipment, furniture, etc. are available at fire-sale circumstances, and also a lot of displaced human capital [unemployed talented people] is also available due to the catastrophe of March-April—is an excellent time for people with the entrepreneurial bent that I lack to jump in and put their ideas in motion, whether those be storefront-based or virtual. I have no doubt that businesses created in 2020 will be some of the very best, strongest money-makers and job-creators and world-changers of the coming decades. If I am reading Business Insider's graph correctly, we are now seeing 100,000+ new business applications most weeks in the second half of this year, clearly more than last winter before the virus.