
Most New Data Show a Continually Improving Economy
even as I still feel a sense of doom in the air (?)

Key Points:
—> "U.S. Retail sales top estimates with biggest gain since June"
—> Harvard big-data indicator of consumer spending shows accelerating gains approaching full recovery
—> Initial claims for unemployment rise while total continuing claims drop, both sharply
—> Two surveys of consumers show "improved economic outlook"
I have to say this 5-week project of mine has me mentally scrambled. From vague sources I can't even pinpoint all of, I get the general sense that the economy has been ruined. That the virus and fear-of-virus have shaken the whole system, leaving our formerly secure institutions, patterns, and expectations in a far weaker and more precarious position than we had imagined possible at the beginning of the year. So then I embarked on this project to try to quantify this vague sense of Catastrophe (as I have been capitalizing it each week) and the degree of recovery. I dusted off my old data analytic and general literacy skills from the 1980s and '90s, opened the Federal Reserve's calendar of economic data releases, and sat down to write.
I started four weeks ago with a look at the numbers on retail sales and the 70% of the economy that consists of consumer spending. My conclusion then:
consumers have recovered their spending very substantially, except for the sectors that inherently require interaction with strangers outside the home. They seem to have the money and the willingness to spend it.
With the passage of another month, we have access to another data point from the Commerce Department. They released it Friday, and these headlines reflect the consensus:
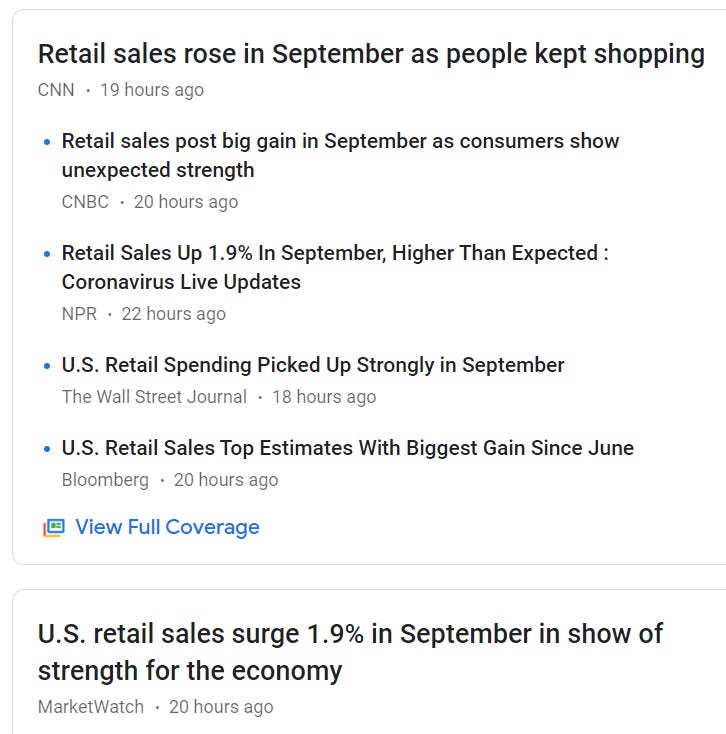
Two of the headlines refer to "higher than expected." Those expectations come from a survey of economists, conducted by the Bloomberg people, asking them to guess the numbers. For Sep retail sales, the guesspectation number was +0.7%, so the overshoot to +1.9% was substantial.
Looking more deeply beyond the headlines, we see these retail subsectors exceeding the aggregate average:
Clothing and accessories stores: +11%
Department stores: +9.7%
Sports, music and other hobby stores: +5.7%
Car dealerships: +4%
Restaurants and bars: +2.1%
Remember the free-$1200-for-everyone checks and the $600 boost to unemployment compensation checks? Most people received the former in April or May, and the latter expired in July. So these high and rising retail sales 2-5 months later indicate, I think, that very large parts of our economy are doing pretty well even without ongoing subsidies or economic life support.
The formerly high-flying subsectors that actually benefitted when the COVID disruption was more acute showed small further gains in Sep:
Home improvement and gardening stores: +0.6%
Furniture stores: +0.5%
Online retailers: +0.5%
and groceries stores were about flat because, in the absence of hoarding, people only eat/buy a certain amount of food month to month.
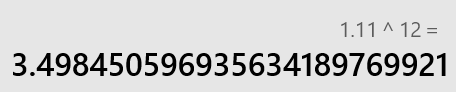
I have to pause for a technical note to stress that all of these monthly numbers are just that: monthly. They have not been annualized. So a subsector like clothing stores that is growing at 11% for a month would have an annualized growth rate expressed as 250%. Here's the calculation showing 1 —> 3.5, i.e., an increase of 250%:
And the monthly +1.9% headline number, similarly, translates to an annualized rate of growth—if the same pace could be sustained for 11 more months—of over 25% [1.019^12]. I'm just saying: don't make the mistake of thinking "Well, 1.9% isn't much; a really healthy economy would be growing >3%"; 1.9% is much when it's monthly, unannualized. It's not just a theoretically possible mistake: NPR made it in their article whose headline is visible above. Trying to add drama to their story, they wrote that, in contrast to September's +1.9%, retail sales "had inched up less than 1% in both July and August." But monthly gains approaching 1% translate to near double-digit rates of growth when compounded for a year.
That's hardly "inching," particularly when it's true that retail sales were already back above pre-COVID levels before August. A month ago, both NPR and I wrote about how August retail sales were 2.6% ahead of one year earlier. After September's further good news, we're now 5.4% ahead of Sep 2019's Goldilocks economy. So, in retail, the V-shaped recovery is more than 100% complete, with the right leg of the V rising higher than the left leg had been last year.
Similar to last month, let's add evidence from the team of Harvard economists at tracktherecovery.org. Using innovative techniques to divine data down to the daily level, they measure total consumer spending (inclusive of retail sales [goods] + spending on services). As of their most current available data from about 3 weeks ago, the situation looks like this:
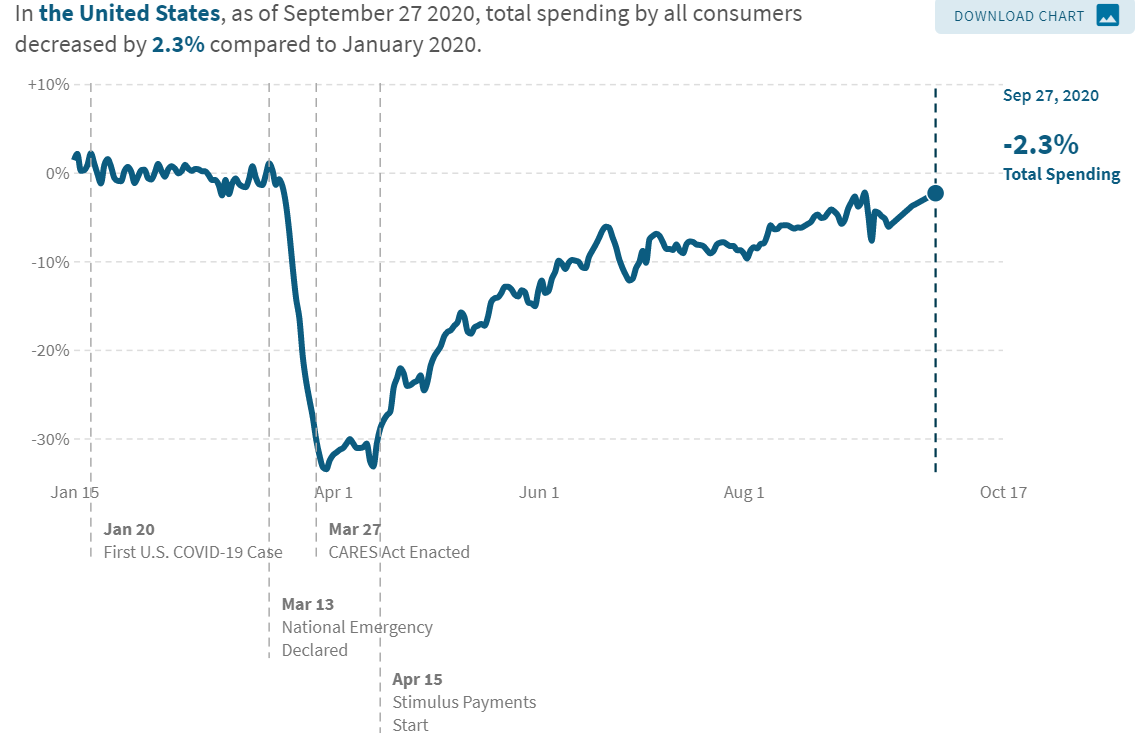
The negative sign on -2.3% is compared to January's pre-COVID old normal, not to the previous month. It means that all but 2.3 percentage points of the entire recessionary hole is now filled, with the right leg of the V being 97.7% as high as the left. A month ago, the corresponding graph (using latest-available data from August 30) showed we were still -7.3% in the hole. About 70% of the remaining recessionary lost ground as of Aug 30 had been made up by Sep 27. The trend over the last four weeks has been clearly positive, showing an improvement from the sort of plateau that we can see held from June into part of August.
Much of the other evidence I've uncovered and discussed in recent weeks has been positive. Not unanimously, but largely.
On the other hand, last week's positive news about initial and continuing claims for unemployment insurance was reversed this week—at least in regard to initial claims~ the news on continuing claims is actually very straight-up positive.
This Associated Press report goes a little further into the numbers than some other sources do. The headline is "US jobless claims rise to 898,000 with layoffs still high". That compares to the 840,000 number that we discussed last week and reflects a noticeable departure from the downward trend that had prevailed since April. The blip up was large enough that even the smoother and more meaningful 4-week moving average reversed its downward course, rising by 8,000. We'll watch the coming weeks to see if the blip forms a trend.
The AP story contextualizes:
The economy is still roughly 10.7 million jobs short of recovering all the 22 million jobs that were lost when the pandemic struck in early spring. … Fraud and issues around double-counting claims have caused many economists to take a more skeptical view of whether jobless aid applications are a precise barometer of layoffs. But most still see an increase in claims as a discouraging sign even if the level may be inflated by people who have filed multiple applications for different programs."
AP also adds information on one of the new, high-frequency indicators:
The job search website Indeed said its job postings were unchanged last week, remaining about 17% below last year’s levels. Many employers still aren’t confident enough in their businesses or in their view of the economy to ramp up hiring. Job postings had rebounded steadily over the summer, but the gains have slowed in the past two months.
Then, just as I did last week, AP turns from initial claims, or the flow of people into the unemployment pool, to continuing claims for insurance, which is a measure of the size of the pool:
the number of people who are continuing to receive benefits dropped 1.2 million to 10 million. That decline signals that many of the unemployed are being recalled to their old jobs.
The Department of Labor's press release [the undated URL links to each new week's report when it is ready, so it stops linking to this week's news in a few more days] adds, calculating based on the continuing or "pool" claims: "The advance seasonally adjusted insured unemployment rate was 6.8 percent for the week ending October 3, a decrease of 0.9 percentage point from the previous week's revised rate."
I'll emphasize that this "insured unemployment rate" is not the same as the regular unemployment rate that makes waves on the first Friday of every month, but it does seem significant enough to mention that this measure of unemployment is down by another big chunk. Initial claims is important for being a leading (crystal ball) indicator, but there's a case to be made—as I did last week—that in these extraordinary times the continuing claims read of the unemployment situation deserves more attention than it conventionally has received.
Beyond those important updates to data series we had previously covered, the week of Oct 12-16 featured a series of surveys of consumer and business sentiment.
The first, on Tuesday the 13th, comes from the Federal Reserve Bank of New York and is called the Survey of Consumer Expectations for September. Their top-line summary reads "Households report improvement in labor market and spending expectations, as well as less pessimistic views about their own financial situations in the year ahead. Home price growth expectations returned to their pre-COVID-19 levels, and debt delinquency expectations remained low."
Digging into their press release, I find areas of optimism in these realms:
fewer expect higher U.S. unemployment one year from now
more say being personally laid off looks less likely (particularly those earning under $50,000), and more say they are more likely to leave their job voluntarily (which people would not do during hard times, typically)
median household spending growth expectations increased from 3.0% in August to 3.4% in September, the highest reading since May 2019
one-year ahead expectations about households' financial situations improved, with more respondents expecting their financial situation to improve and fewer respondents expecting their financial situation to worsen
There were some downer notes in the report, including:
perceptions about households' current [as opposed to future, in the previous bullet] financial situations compared to a year ago deteriorated slightly, with slightly more respondents reporting being worse off
although the summary statement above mentioned that debt delinquency expectations remained low [perceived probability of missing a minimum debt payment over the next three months stayed below the 2019 pre-COVID average (11.5%)], that number increased from 9.7% in August to 10.7% in September.
Wow, that square bracketed material just above strikes me as highly counterintuitive, or at least strongly at variance with what I am hearing the pundits say on the news. It's interesting that actual people surveyed by the NY Fed are saying something very different from the TV talking heads. There again is that "mentally scrambled" sensation that I started with this week.
Then, on Friday the 16th, the University of Michigan released their preliminary, mid-month report on Consumer Sentiment for October. They release very little actual information, mostly consisting of 3 index numbers, but I did find one write-up from Bloomberg that went a little deeper:
U.S. consumer sentiment ticked up in early October to a seven-month high on an improved economic outlook, though confidence remained well below pre-pandemic levels.
The University of Michigan’s preliminary sentiment index for October advanced to 81.2 from a final September reading of 80.4, according to data released Friday. The median estimate from economists surveyed by Bloomberg was for 80.5; the index was at 101 in February, near the highest since 2004.
The gauge of current conditions decreased 2.9 points to 84.9, while a measure of expectations rose 3.2 points to 78.8.
While the result indicates pessimism about the future has diminished a bit, views of buying conditions for durable goods worsened in the survey, pointing to slightly less appetite for big-ticket purchases ahead of the holiday shopping season. In addition, the gap between Democrats and Republicans on sentiment remained wide.
With that, I'm above my weekly word count. I had several other surveys lined up for analysis, but no time/room for them now. I refer you to the links:
https://news.gallup.com/poll/319220/small-business-owners-optimism-april-below-pre-covid.aspx
https://www.cnbc.com/2020/10/13/imf-world-economic-outlook-2020-amid-coronavirus-crisis.html
and especially this one:
NFIB SENTIMENT (Oct 13) = https://www.nfib.com/surveys/small-business-economic-trends/ and https://assets.nfib.com/nfibcom/SBET-September-2020.pdf
I have 7 charts and tables pulled from this NFIB Small Business Optimism Index report that I was prepared to turn into fascinating reading. Maybe I'll have to do that separately, as a special issue of NO-BAH-DI-NOZ.
Thank you, and subscribe if you like.
p.s I just found this, without even looking for it:
https://losangeles.cbslocal.com/2020/10/16/feds-arrest-rapper-bragged-about-getting-rich-filing-fraudulent-edd-claims-music-video/
... relevant to one little bit of what I quoted from an Associated Press news report