I wrote a week ago that I would make a practice of beginning these newsletters with a look at the Weekly Economic Index (WEI) compiled by the Federal Reserve Bank of New York. I do so because of the broad-based, comprehensive, and highly timely nature of the ten daily and weekly indicators (detailed below) that go into the composite number. That number—shown in blue below—rose again last week to -2.68, up from -3.18 in the previous week and -3.51 the week before that. The low point in April, the cruelest month, was -11.45. In this way of looking at it, the COVID hole of April is now over 76% re-filled.
Clearly there has been no slowdown in the rate of improvement since the spring.
How to interpret those negative numbers is explained at the site's FAQ page:
The WEI is scaled to the four-quarter GDP growth rate; for example, if the WEI reads -2 percent and the current level of the WEI persists for an entire quarter, we would expect, on average, GDP that quarter to be 2 percent lower than a year previously.
So, we think that overall economic activity [GDP] in Q4 2020 will be 'recessed' by about 2.68% compared to the pre-COVID, prosperous baseline set in Q4 2019. Extrapolating: if the economy were keep improving at a similar pace for another 7-8 weeks, we would be all the way out of the hole — de-recessed, if you will.
In a previous newsletter I listed the ten components of the Weekly Economic Index, but here I reproduce a table from the same FAQ page providing a longer description of the ten, so that you can better understand and evaluate what we are talking about.
The New York Fed provides a single brief paragraph of Commentary each week. Here is the latest:
The increase in the WEI for the week of November 7 was due to a decrease in initial unemployment insurance claims, which more than offset decreases in electricity output, tax withholding, and rail traffic (relative to the same time last year).
That information about initial unemployment insurance claims is the best known and most widely followed of the ten sub-indicators. It comes out every Thursday, and as usual generated lots of news and reaction this week. As we just saw from WEI, the very substantial good news about unemployment claims dominated the week's other news. CNBC reported "Jobless claims fall again in another sign of labor market improvement."
I'll save myself some writing time by quoting extensively from that CNBC story:
[J]obless claims hit 709,000 for the week ended Nov. 7, down from 757,000 the week before. Economists surveyed by Dow Jones had been looking for 740,000 new claims.
This marked the fourth consecutive week that the total declined from the previous period, though claims remain above the pre-coronavirus pandemic record 695,000 in 1982.
In addition to the decline in the weekly pace, continuing claims also again saw a significant decline, falling to 6.79 million, a 436,000 decrease from a week ago.
However, the level of those still collecting remains high as thousands of workers who are seeing their regular benefits expire migrate to the Pandemic Unemployment Assistance program. Initial claims under the program totaled 298,154 for the week, though that actually was a decrease of 63,805 from the week before.
As of Oct. 24, 21.16 million Americans were collecting some form of assistance, a decrease of 374,179. A year ago, that total was 1.45 million.
While unemployment remains a significant problem in the U.S. as the economy rebuilds from the coronavirus shutdown, the numbers have been getting progressively better.
Nonfarm payrolls increased 638,000 in October, significantly better than Wall Street expectations. In all, about 12 million of the 22 million positions lost during March and April have been recovered as the unemployment rate has fallen to 6.9% from its high of 14.7%. The jobless rate was 3.5% before the pandemic declaration in March.
That last paragraph is not new news this week, but rather a repeat of what we learned from the latest monthly jobs report on Nov 6 (and which I discussed at length in last week's newsletter).
CNBC also gives us this visual, which I include here so that I can refer to it later.
Otherwise, the week was a very slow one for macroeconomic data. We did get two competing surveys of consumers' attitudes. On Monday we heard again from the New York Fed about their Survey of Consumer Expectations (SCE) for October, and on Friday it was the University of Michigan's index of consumer sentiment. The home page of the SCE summarizes the main point in one sentence: "The October Survey of Consumer Expectations shows households reporting a decline in income and spending growth expectations and a mixed labor market outlook."
The bit about declining expectations for income and spending growth seems underwhelming. The full press release, linked above, reveals that the number for income is now right in the middle of the range that has prevailed all year; and that the number for spending is the same very ordinary-seeming +3.1% as it was in February—i.e., not bad.
Regarding that mixed outlook for the labor market, going deeper into the full press release, on the optimistic side we see:
a third consecutive monthly decrease [improvement] among respondents without a college education regarding their expected rate of unemployment one year from now; and
a decrease [improvement] in the perceived probability of losing one's job in the next 12 months.
On the pessimistic side for labor conditions we see:
a decrease in the probability of leaving one's job voluntarily in the next 12 months; and
a demographically broad-based decline in the perceived probability of finding a job if one's current job was lost, to its lowest reading since April 2014.
One additional data point from the SCE is this:
The average perceived probability of missing a minimum debt payment over the next three months decreased from 10.7% in September to 9.3% in October, remaining below its 2019 average of 11.5%.
A month ago I wrote about the mis-match between this evidence and what we hear about looming foreclosures, evictions, and such. Perhaps "missing a minimum debt payment" is a very different thing from "missing the rent or mortgage," but I don't really think so. Now this month, the evidence in this NY Fed survey about consumers' own understanding of their situation is even more contrary to the idea of a looming foreclosure crisis. I really don't know what to make of this.
Turning to the U of Mich index of consumer sentiment, the news is as much about politics as it is about economics. In a survey conducted in the week before and the week after election day, respondents came in negative, contrary to the guesspectations of the Bloomberg people. The decrease followed three months of increases, and brought the index to the lowest point since August. Breaking it down, consumers' impressions of current conditions were little changed, but their expectations of the future saw a big drop.
But, very interestingly, only some consumers formed a dim view in the last couple weeks or so:
Much of the decline came from a dive in expectations among Republicans following the early November elections. Democrats' expectations for the economy were little changed despite President-elect Joe Biden winning the presidential race.
“Republicans now voice the least favorable economic expectations since Trump took office, and Democrats have voiced more positive expectations,” Richard Curtin, director of the survey, said in the report.
This seems to indicate that the results are colored, or even tainted, by political considerations and may not be very useful as a leading economic indicator.
I have space in this week's word count to back up and consider the big picture. Each week I see lots of info and opinion. Two sources that reach me regularly are a sort of newsletter from veteran investment banker Joel Ross and the "Thoughts from the Frontline" of investment advisor John Mauldin. Ross has been relentlessly optimistic, and Mauldin heavily pessimistic. (I quoted Mauldin a few weeks ago admitting for the first time in 2020 that some "green shoots" were appearing in the economy.)
Here's Ross from yesterday, Nov 14, with information I have not previously relayed highlighted in bold:
Despite the press continuing to say we are in an economic crisis, it is not true. Jobless claims are down to 709,000 from 757,000. The number of people on continuing unemployment dropped by over 400,000. There are now 10 million job openings, almost as many as in February. Despite the virus surge, business continues to grow. Consumers have money they did not spend the past 8 months. Savings accounts at banks are now $15.9 trillion up from $13.2 trillion one year ago. That proves consumers have cash [on] hand, and can spend as things get better and open up more. Gas prices remain very low which is a real boost to low income workers. Most people have refinanced their mortgage, so their debt service is very low now. Wages in some fields are up materially because it is again hard to find decent people to hire in some fields. People are fed up hiding out, and are now getting out and spending, but still have a lot of savings. Q4 is likely going to be better than the 5% many predict, unless there are a bunch of lockdowns again. Most companies in manufacturing are doing very well, as are tech companies. The main ones suffering are the same as it has been, tourism, entertainment, and leisure related.
And here is an extended excerpt Mauldin from Friday Nov 13, with four of his visuals and some bold emphasis added by me:
The summer economic bounce seems to have run its course, and I think we know why. The growth was mostly artificial, generated by the trillions of dollars consumers received from government and central bank programs. These have now expired, or will soon, and the politicians have been unable to agree on a new package.
Dave Rosenberg put a pencil to this and came up with these 2021 GDP estimates, based on vaccine timing and efficacy.
Those numbers are full-year 2021 GDP estimates. They suggest we can expect 3% or better growth next year if the vaccine is at least 55% effective and is widely distributed in the first half of the year. But as Dave notes, everything has to go right for that to happen. Realistically, the recession will continue at least through Q1 2021, even if the vaccine campaign goes well.
However, remember that GDP is down by 10% from where we were. [Lauridsen note: No, we're down less than 3% from where we were, as I showed in the WEI chart and discussion at the top of this week's newsletter.] We are not going to be back to “normal” by the end of 2021. Recoveries in GDP and employment typically take about 46 months. But Rosie is right, a vaccine is critical.
Let’s take a quick look at what we are facing. Some 20% of small businesses are closed. Most of those will never reopen. Chain stores have closed 47,000 locations and are aggressively renegotiating rents. Some are simply refusing to pay their rent because they don’t have the money. They are trying to hold on until the economy turns around. They can’t do that if they don’t hoard cash. The longer this goes on, especially if we see more closure orders, the more businesses we are going to lose. That means local tax revenue and jobs.
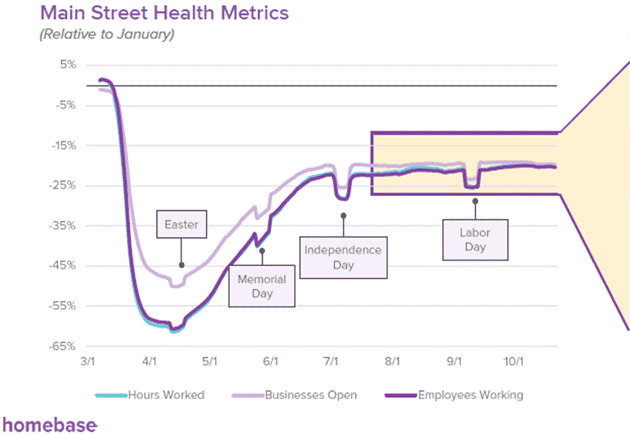
The Homebase data, which I’ve shared before, shows improvement has flatlined since July. [Lauridsen note: I have tracked down the source and linked to it.]
It’s even worse for industries. Overall, small business revenue was down 21%. Leisure and hospitality were down 47% as of October. The new restrictions we are seeing in many states are going to make it much worse.
Source: WEF
. . .
I could literally bury you in data on business closures and government revenues. Back in June, Mike Roizen and I wrote a joint letter saying the first priority should be protecting the vulnerable, wearing masks and social distancing. We were not in favor of further lockdowns. The data continues to agree, but states are again doing it. This is going to further hurt small businesses.
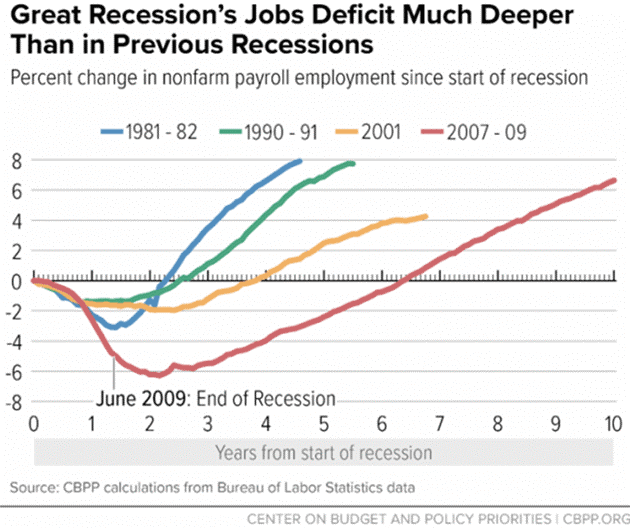
It is unrealistic to assume we will go back to some kind of “normal” in 2021. I think even 2022 will be a stretch. We have had a massive and severe blow to our economy. The chart below from the Center on Budget and Policy Priorities shows how it took four years to recover from the 2001 recession in terms of jobs and over six years for the Great Recession. The current recession is much worse than either of those.
The recovery is going to be longer and slower and more costly in terms of stimulus and Federal Reserve involvement.
. . .
We have a chance to return to the next new normal. Just don’t expect it to show up in 2021. We will see the green shoots, of course, but it will look more like the recovery of 2009-14. It helps that we can now rule out the possibility of higher tax rates. Raising taxes during a recession is never a good idea and would have created a double-dip.
My rejoinder to Mauldin is this: In my brief nine weeks of doing this project, I am presenting evidence every week that directly contradicts (or at least calls into serious question) the portions of his analysis that I have bolded. For example, scroll back up through this newsletter and see the two graphs on WEI and continuing claims for unemployment insurance. Neither of them shows anything resembling a flatline starting in July, as Mauldin believes based on the Homebase Main Street Health Metrics that he cited. (I had not heard of that one, so I thank Mauldin for pointing it out; I am making a note of paying close attention and probably writing about it more extensively in three weeks.)
Frequently I have presented graphs that show major sectors of our economy recovering in a pattern that looks much faster/steeper than the recovery after 2008—completely contrary to what I just quoted Mauldin as saying. Just one week ago, I wrote, "Notice that the Great Recession of 2008-09 dug a job hole that took about 5 years to dig out of, but see how the steepness of the recovery in 2020 is in a whole different league—we've seen about six years worth of 2010s jobs gains in just six months."
Look again at Mauldin's last multi-colored graph of employment in the last 4 recessions and notice that missing is a line showing 2020. If present, it would show a huge vertical drop for two months, followed by six months of much steeper jobs gains than anything in those other four colored lines. See last week's newsletter for data and graphs of the jobs growth that I called "extremely strong." (Mauldin is really off base here, and if I thought he did that very often I would stop giving him the time of day.)
Not only this week's two graphs, but also virtually nothing else in the past two months has vindicated the Homebase view of flatlining since July: not the government's employment and unemployment stats (nor ADP's private-sector employment stats), not factory orders and various purchasing managers' indices, not surveys of consumers, not retail sales, not GDP itself, and not the small business survey I wrote about in a special edition published yesterday, Nov 14.
It strikes me as a big risk that the various types of 'lockdowns' imposed by the governors of several states in recent days will quickly cause the recovery to flatline or worse. But quite apart from trying to predict the future, I'm still trying to get an accurate read on the present and recent past, which is quite difficult enough.
For now, the best evidence I have is seen in the Weekly Economic Index at the top of this week's newsletter and the myriad other indicators in recent weeks: the economy has recovered substantially from the COVID crash, and at a rate faster than we have seen since at least as far back as the sharp, brief recession of early 1980.