The busy week of Jan 4-8 has left me with hardly any energy to devote to this project. Broadly, the statistics released early in the new year show our economic situation looking more tenuous than we were thinking in December. But if you are thinking the worst part was the news on (un)employment, the evidence is to the contrary.
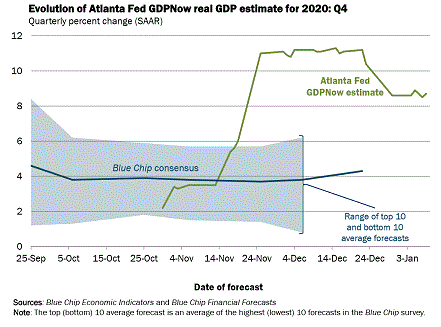
Regular readers will know that I follow the Federal Reserve Bank of Atlanta's GDPNow 'nowcast,' a mechanical exercise generated by their econometric model: they input the most recent data and let the formulas spit out a numerical estimate of the percent rate of growth of Gross Domestic Product for the current or most recent quarter. Of course the fourth quarter of 2020 is past, but the official data for it are still being compiled, to be released by the Bureau of Economic Analysis (Department of Commerce) on Jan 28. So GDPNow is nowcasting that Q4 number. After fantastic news right before Thanksgiving, Atlanta's model abruptly shot up from a Q4 growth rate of 3.5% to a level at or above 11%. That plateau held from Nov 25 to Dec 17. Atlanta's last update of 2020 revised the Q4 nowcast to10.4%
During the week just past, the Atlanta Fed updated GDPNow on an unusually high four occasions: Monday, Tuesday, Thursday, and Friday. The new nowcasts on those four days were 8.6%, 8.9%, 8.5%, and 8.7%. So you can see that the (un)employment report, coming out Friday morning, did not shift the outlook downward; rather, that or other news left Q4 looking right in the range where the week had started, an higher than on Thursday. The big drop occurred on Monday morning, incorporating that morning's news and the trickle of news from the previous two holiday weeks.
Here is the full graph of the evolving Q4 nowcast:
The November gain followed a bigger 1.6% rise in October and left construction spending up 4.4% through the first 11 months of 2020 compared to the same period in 2019, according to the Commerce Department.
For November, spending on residential construction rose 2.7% with single-family construction surging 5.1 percent while apartment construction was flat, according to the new data released Monday. Record low mortgage rates have spurred strong demand for housing even as a global pandemic resulted in widespread lock downs for other parts of the economy.
While housing activity, fueled by low supplies of available homes, stands 16.1% higher than it did a year ago, spending on private nonresidential projects is 9.5% below the levels of a year ago with hotel and motel construction down 26.5% from the level in November 2019 and office construction down 6.6%.
Something happened in the economic indicators between Dec 23 and Jan 4 that brought the GDPNow-cast down from 10.4% to 8.6%. I have to admit I'm confused about what it is. My two previous newsletters covering the rest of the Dec 23 – Jan 4 interval turned up very little that was amiss. The day after the Dec 23 GDPNow update, Christmas Eve, had one major data release: US: Durable Goods Orders rise by 0.9% in November vs. 0.6% expected, which clearly does not call for downward revisions. And my report for the week of Dec 28-31 (i.e., just one week ago) led with a Key Points bullet reading " A slow week for data, but what we see looks good for December." Then, The only new data point on the calendar for Jan 4 was the one cite above, and it was "solid" (the ongoing troubles in non-residential projects such as hotel construction notwithstanding, and not unexpected).
Two weeks ago, my Dec 27 newsletter included a Key Points bullet summarizing, "Every measure of the housing market is so hot that it's too good: buyers can't find homes." Three days later, the National Association of Realtors (NAR) issued another report headlined as you see in this URL: https://www.nar.realtor/newsroom/pending-home-sales-slide-2-6-in-november. My best guess, after spending about three hours poking around through these couple weeks of data, is that this is the one that weighs more heavily in Atlanta's model than I had thought when I excluded it from my write-up last week. Since the level of housing construction and spending activity is so historically high at this time, I thought a little backing off of all time highs was no big deal, not taking into account that a drop from all-time highs still registers as a drop when it comes to the mechanistic way the GDPNow model works. Housing spending is part of the "investment" category of GDP, and so it would feed directly into that model.
Here, then, is the pull quote from the above-linked NAR report for November, from December 30, demonstrating the underlying, even extreme, health of the housing market even while the top-line number (the one that feeds into the statistical models) is negative:
The Pending Home Sales Index (PHSI), www.nar.realtor/pending-home-sales, a forward-looking indicator of home sales based on contract signings, fell 2.6% to 125.7 in November, the third straight month of decline. Year-over-year, contract signings climbed 16.4%. An index of 100 is equal to the level of contract activity in 2001.
"The latest monthly decline is largely due to the shortage of inventory and fast-rising home prices," said Lawrence Yun, NAR’s chief economist. "It is important to keep in mind that the current sales and prices are far stronger than a year ago."
"The market is incredibly swift this winter with the listed homes going under contract on average at less than a month due to a backlog of buyers wanting to take advantage of record-low mortgage rates," Yun said.
Once the housing news of Monday Jan 4 was built into the Atlanta model to yield a downward revision, the rest of the week moved the nowcast only small amounts up or down, as we have already seen.
The Institute for Supply Management (ISM) publishes a series reports each month based on surveys of purchasing managers [PMI = Purchasing Managers' Index] at private-sector firms. Separated into manufacturing and services, the commonality is that the data are diffusion indexes, meaning the number 50 is the dividing line between expansion and contraction: any number above 50 is good. ISM writes especially detailed and revealing press releases, including nifty graphics and excerpts from press coverage of their data. I excerpt, first, from the manufacturing report of Tuesday Jan 5:
the December Manufacturing PMI® registered 60.7 percent, the highest figure in 2½ years. The manufacturing sector’s resiliency was evident in much of the data, with the New Orders and Production indexes above 60 percent for the sixth straight month and the Inventories Index expanding despite continuing supplier delivery challenges. However, COVID-19 exposures and fears are resulting in labor issues for suppliers that, with cases and hospitalizations continuing to surge in the U.S. and a hamstrung vaccine rollout, are likely to get worse before they get better.
Bloomberg:U.S. Manufacturing Gauge Expands at Fastest Pace Since 2018. “For months, the manufacturing sector has been steadily recovering from the pandemic’s devastating blow early last year. Though a full recovery will take time, the latest data underscore how a strengthening economy and lean inventories should continue driving production and factory employment gains. … The overall manufacturing figure was also boosted by longer lead times, likely a result of still-challenged supply chains and COVID-related effects on the labor force.”
Here's one headline interpreting the above:
We have already seen that Atlanta's GDP took this news and moved their Q4 nowcast up 3 ticks on Tuesday.
The Services PMI™ reading of 57.2 percentbeat analysts’ expectations, particularly in light of dire news and expectations on employment, as the coronavirus (COVID-19) continues to wreak havoc on jobs numbers. The Employment Index registered 48.2 percent to fall into contraction territory after three months of growth.
But the composite figure indicated a seventh straight month of growth for the U.S. services sector and showed that it withstood what was expected to be a challenging combination of a holiday surge and pandemic-related business restrictions — with the latter expected to continue well into the new year.
“It’s a good report, even though we’re still seeing shutdowns and problems due to COVID-19 having an impact, specifically with food services and other industries that have more (customer) contact,” Anthony Nieves, CPSM, C.P.M., A.P.P., CFPM, Chair of the Institute for Supply Management® Services Business Survey Committee, told reporters on a conference call.
In the meantime, on Wednesday came the first of two major reports on the (un)employment situation. ADP, the payroll processing firm, gets a two-day jump on the official Bureau of Labor Statistics in releasing monthly jobs growth numbers. The graphic from the press release tells the story:
At an industry level, the battered leisure and hospitality sector led the cuts with 58,000, as states and municipalities brought back restrictions on indoor dining, while outdoor eating became less practical as colder weather set in.
Almost all the layoffs came from companies that employ more than 1,000 workers as hotel and restaurant chains cut back on staff. …
Industries seeing growth included professional and business services (+12,000), education and health services (+8,000) and construction (+3,000).
Then on Friday came confirmation of the same basic story from the Bureau of Labor Statistics. Here is the first half of CNBC's writeup, including one of their graphics:
Job creation came to a halt in December as restrictions brought on by surging Covid-19 cases hammered virus-sensitive industries, particularly bars and restaurants, which lost nearly half a million positions.
The Labor Department reported Friday that nonfarm payrolls fell by 140,000. That was below expectations for 50,000 from economists surveyed by Dow Jones. It was the first monthly drop since April.
The unemployment rate was unchanged at 6.7%, compared to a 6.8% estimate. An alternative unemployment measure that includes discouraged workers and those holding part-time jobs for economic reasons declined to 11.7% from 12%.
“Today’s report showed the economy’s not just tapping on the brakes, but actually has been thrown into reverse,” said Daniel Zhao, senior economist at job search and review site Glassdoor. “It’s obvious how bad the winter wave of the pandemic has been, and the economic data is now starting to reflect that.”
Markets shrugged off the disappointing report, likely on the anticipation that it strengthened the case for more stimulus from Congress and reflected a likely temporary reduction in jobs that would be reversed as Covid vaccine distribution accelerated. Stocks opened Friday’s trading with modest gains. [The Standard & Poor's 500 Index rose each day Tuesday through Friday.]
“In some ways, bad news is good news, because it increases the probability for more stimulus,” said Michael Arone, chief investment strategist for US SPDR Business. “Investors have convinced themselves this week that given what’s happened in Georgia, given the weakness in the economic data, that more help is on the way. We’re going to get more fiscal help, and it’s likely to happen pretty soon.”
Since a recovery that began in May, the economy had recovered 12.3 million of the jobs lost. The biggest hit has come in the hospitality industry, where hotels, restaurants and bars suffered under the yoke of restrictions that limited travel, dining and drinking. December’s job tally showed the impact has intensified.
In spite of the negative nature of Friday's jobless news, we saw at the top of this newsletter that Friday's GDPNow-cast actually bumped up the Q4 GDP picture by 2 ticks, based solely on the new data from Friday morning.
For a little larger perspective on these two jobs reports and what they imply for the longer future outlook, I recommend these two articles:
Sorry that I just don't have the time or energy to say more about them and assemble excerpts and such. I hope that next weekend I'll be back to my usual higher standards for this newsletter, according to which I do more of my own original analysis and less quoting.