
Some Predict New Recession Next Year
But no indicators are showing it now

Key Points:
Weekly index rises again (but more slowly)
Manufacturing in NY up, and nationwide up much faster
After already recovering all of the COVID losses, retail sales rise further
The same is true of weekly rail traffic
… and of new home construction and existing home sales (which are running well ahead of last year already)
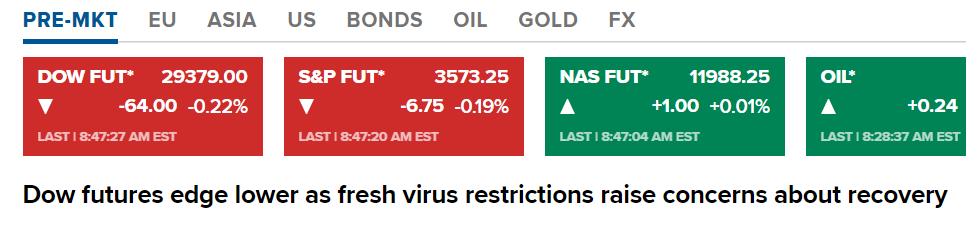
Even against a backdrop of headlines like these:
https://www.cnbc.com/2020/11/20/jp-morgan-says-first-quarter-gdp-will-decline-because-of-rising-covid-cases-and-restrictions.html
and
… the economy continues to grow at rates that range from moderate to powerful. Without really intending it this way, the several data series analyzed below are arranged close to perfectly in that order: from moderate/meh to powerful growth. Among indicators of economic activity, the forward-looking (leading) ones including those related to housing are among the rosiest. Aside from four of the components of the Weekly Economic Index mentioned in the first indented quotation below, no significant measure this week or in any recent week is negative.
This week's look at the latest indicators of the health and direction of the national economy begins, in line with my recent habit, with the Federal Reserve Bank of New York's Weekly Economic Index (WEI), a composite of 10 daily and weekly indicators covering steel manufacturing, retail, employment, consumer confidence, fuel output/sales, tax receipts, and more. A week ago I reported that the index "rose again to -2.68, up from -3.18 in the previous week and -3.51 the week before that," and in fact that gave rise to my headline about another week of "non-decelerating growth." This week, last week's number was substantially revised: the big gain from a week ago has been replaced by a much smaller gain from -3.18 to -2.96, and then the new data point showed slow growth to -2.84.
(The negative numbers are scaled in a way that says it's looking like 4th quarter GDP this year will be about 2.84% lower than the same quarter in 2019. At the worst point in April, the number was -11.45%.)
The upshot is that after another week of what we hoped was progress, we now think we are in a less happy place than we thought we were last week. The right end of last week's blue line on the graph looked healthily, steeply upward, but this week's new graph looks a little limp, comparatively:
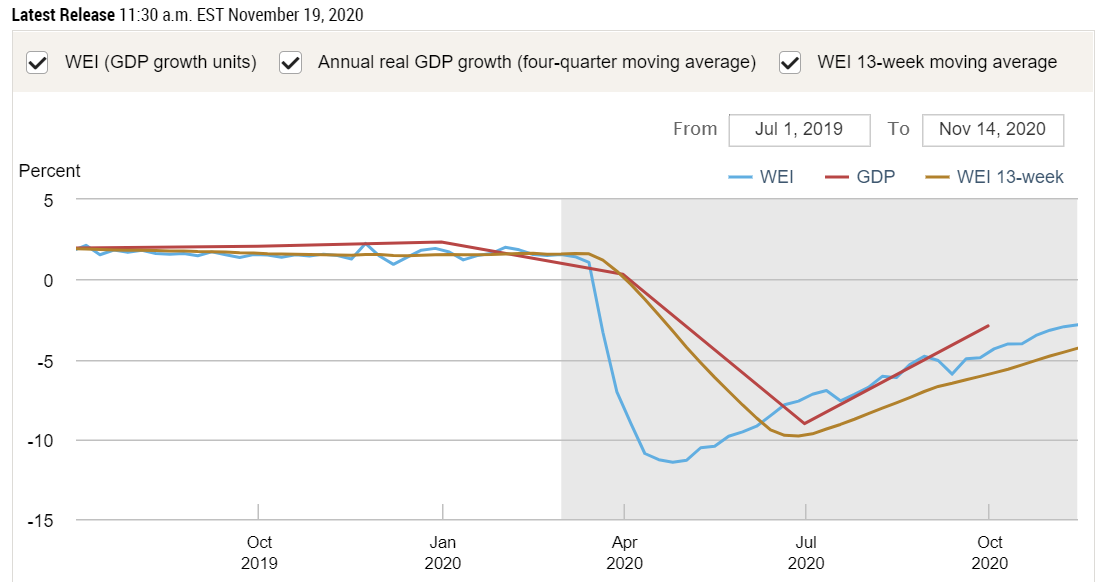
Even healthy periods such as April-present are not straight up every single week, as we see in little stepbacks in July and in September, which is why a moving average (the golden line) is also helpful to see. While the data have been up every week since early/mid September, the most recent rate of improvement no longer looks as impressive as it did just last week. Since the new number, too, is subject to revision as more complete data trickle in, I'll be sure to track this again next week and beyond.
The NY Fed's brief statement of Commentary accompanying the WEI graph says:
The increase in the WEI for the week of November 14 (relative to the final revision for the week of November 7) is due to an increase in rail traffic which more than offset a rise in initial unemployment insurance claims and declines in fuel sales, tax withholding, and electricity output (relative to the same time last year).
So four of the ten sub-indicators were flashing negative by a big enough amount to mention, but they were just more than offset by improvements in rail traffic. Since this rail traffic data point is not one that I have been familiar with, I looked it up. What I found is interesting, but maybe in a rather wonky and minute way, so I am stashing that information at the end of this newsletter, as a sort of coda.
The week began with another report from the New York Fed, which I hesitate to mention because it by definition covers activity in only that one state. It's the monthly Empire State Manufacturing Survey. I've never paid attention to it before, and I do today only because I can pair it with the more comprehensive index of (nationwide) industrial production just below here. They gather 10 different "Current Indicators" and a dozen "Forward-Looking Indicators," all of which boils down to this summary for November:
Business activity expanded in New York State, though only slightly, according to firms responding to the November 2020 Empire State Manufacturing Survey. The headline general business conditions index fell four points to 6.3, pointing to a slower pace of growth than in October. There was a small increase in new orders, and shipments were modestly higher. Inventories moved lower, and delivery times were steady. Employment levels and hours worked both rose. Input prices increased at about the same pace as last month, while selling price increases picked up. Looking ahead, firms remained optimistic that conditions would improve over the next six months.
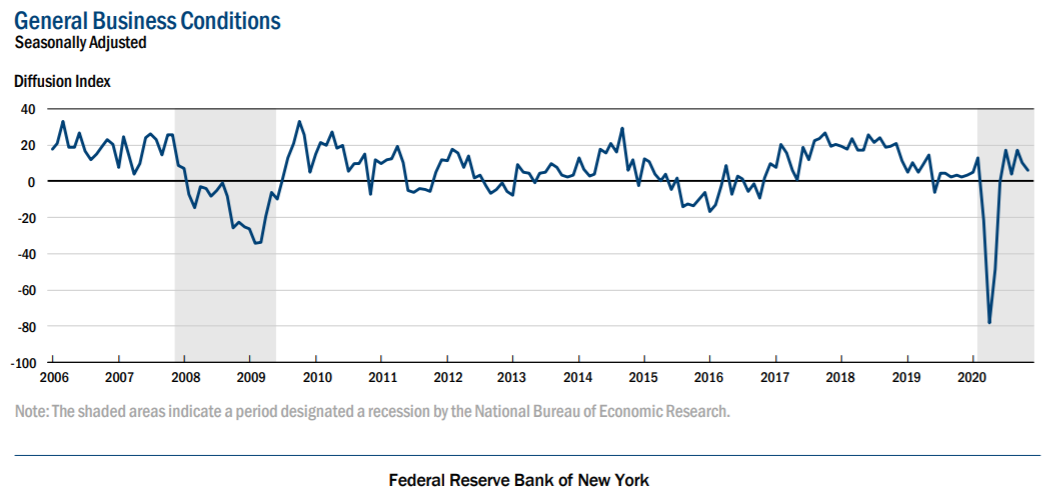
If the parts about "activity expanded" and "the index fell four points" sound contradictory, it is because of their use of a "diffusion index," which basically calibrates everything to a "0" baseline. They do that by working with numbers like these: "Thirty-one percent of respondents reported that conditions had improved over the month, while 24 percent reported that conditions had worsened." The difference, adjusting for rounding, is the 6.3 index number that they reported and graphed. So, any number above 0 means 'improved' > 'worsened,' indicating expansion, growth. A month ago, the 'improved' > 'worsened' difference was wider, which is how we can have the index number falling from then to now, and have it still indicate that conditions are positive.
Check the recessionary gray area of Dec '07 – June '09. The Empire State general business conditions index lay in the negative zone for almost those exact months, except for a couple months right at the beginning of the collapse. Judging by that precedent, we've already been out of the 2020 recession for some time. I'm saying this is another little clue that when the National Bureau of Economic Research eventually determines an end date of this recession, it will probably be April or May. They have already pegged the start date to February. Even if I'm wrong and they say the recession lasted into June, it will be the shortest ever recorded. (The current shortest is the one of Jan – July 1980, the recession that—along with some hostages—ended the Carter Presidency.)
Of Empire State Survey's dozen forward-looking indicators, the most broad or general of them is this:
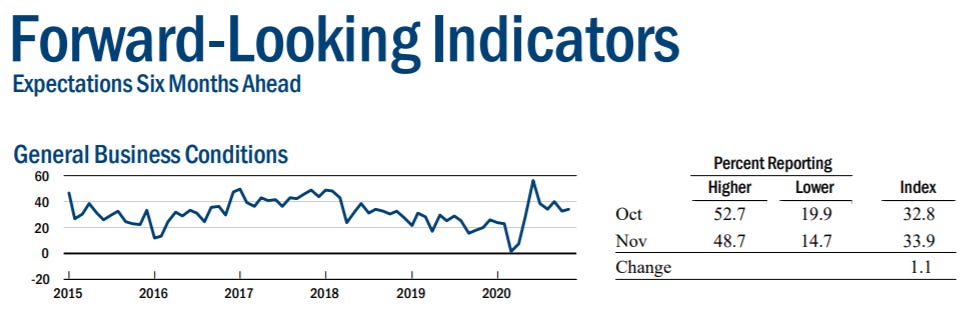
You can see that the last thought in the summary paragraph quoted above, that "firms remained optimistic," is definitely true. Optimism in late 2020 is above what it was in all of 2019 and about equal to the best that it gets in go-go years like 2018.
Turning now to sort of a national counterpart to this Empire State Survey, we consider the Index of Industrial Production published monthly by the (national) Federal Reserve. This is the data set that I worked with most closely in my prior career in econometrics and macroeconomic forecasting at the old DRI/McGraw-Hill. The data series is one of the oldest ones of such high quality in the United States or the world, now almost 102 years old. Covering the large manufacturing sector and the smaller mining and utilities sectors, it is considered a strongly coincident indicator. That means that, like the Empire State numbers just above, it syncs up in time very closely with GDP and recessions, neither leading (anticipating), nor lagging behind the general level of economic activity.
I reprint portions of the Associated Press' write-up of the official Fed numbers:
U.S. industrial production rose 1.1% in October, recovering much of the spring decline caused by the virus pandemic.
It was a rebound after a downturn in September, but production still remains below pre-pandemic levels, the Federal Reserve reported Tuesday. The rise was slightly better than the 1% analysts were expecting and combined with an upward revision in September’s number, has to be seen as good news as coronavirus cases spike across the U.S. and states re-instate restrictions.
It’s unclear what manufacturers will face in the coming months, but a sudden decline in demand, possibly combined with government-imposed restrictions on their operations due to the virus, could severely dampen industrial output.
A key category that reflects manufacturing output rose 1%, but is still about 5% below its level in February before the coronavirus outbreak swept through the U.S., closing businesses, factories and schools. …
September’s number was revised upward from -0.6% to -0.4%. It remains the only decline since April’s 12.7% drop.
From the Federal Reserve Bank of St. Louis's graphing-friendly public databank known as FRED—using, for comparability, the same July 2019 starting point that I have chosen for my Weekly Economic Indicators graphs:
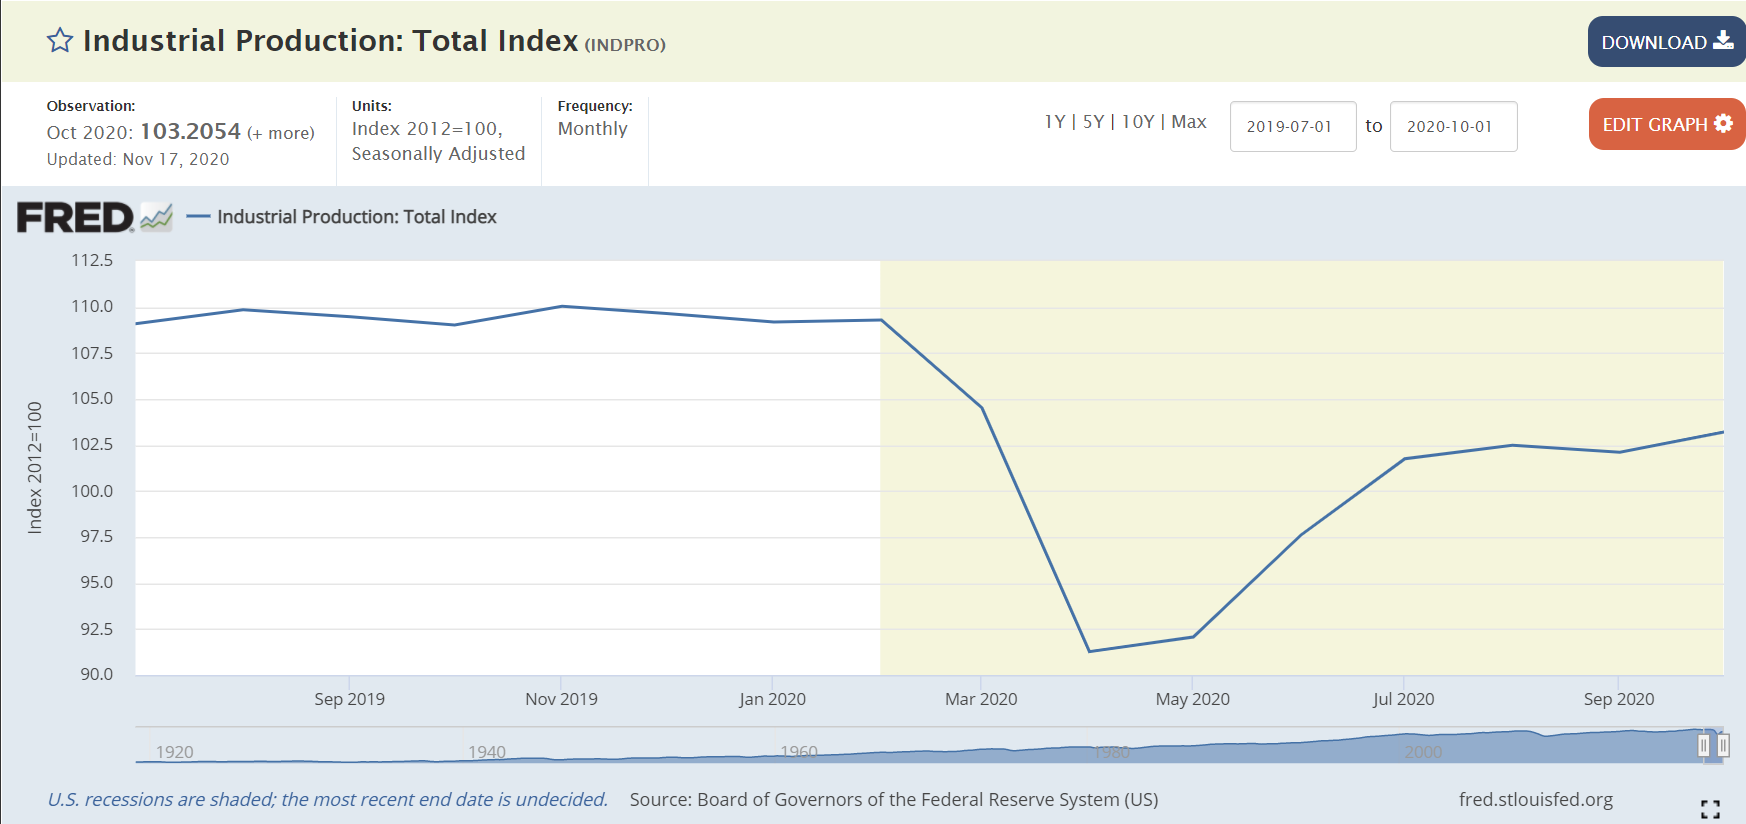
Here is a graph that backs up the idea that I presented and argued against last week: the conclusion, supported by John Mauldin and the Main Street Health Homebase data that he cited, that the recovery hit a plateau in July and has been basically flatlining ever since. Plenty of other data do not support this view, such as the WEI at the top of this newsletter and the rail traffic data in the coda below. But this one does resemble the "square-root sign in a mirror" √ as an alternative to a V-shaped, U-shaped, or K-shaped, one-letter model of our recovery. Still, the news for October was good, with +1.1% being the largest monthly gain since July. And those monthly figures are not annualized, but straight month-to-month percentage changes.
For several indicators I have calculated the %age of the COVID hole that we have recovered to date. I do this by comparing the gain from the low to the present, as a percent of the loss from pre-COVID high to that low. As usual, April 2020 marks the low, and in this case I'm using February for the high. For industrial production we've now regained almost 12 of the just over 18 index points of COVID crash, so by my measure the recovery is 66% complete. This is less than what we have found in several other data series. The WEI numbers above show about 75% recovery, the rail traffic below shows over 100% recovery, and we will see retail sales next.
Retail sales is another coincident indicator. Five weeks ago, I led with headlines that sales had "surged" (Marketwatch) and "picked up strongly" (Wall Street Journal) in September, rising to higher levels than on year earlier. So, again here, we have a >100% recovery from the COVID lows, already. The new news for October, as reported and graphed by NPR:
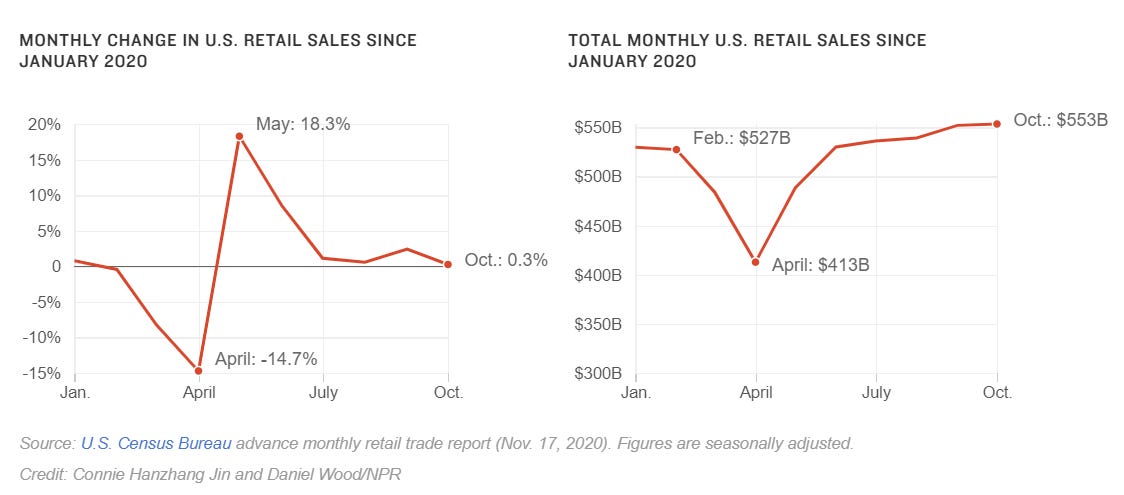
Shoppers kept buying electronics and home improvement supplies, but October proved a month when much of the retail world held its breath. Retail sales barely budged, inching up just 0.3% from September, the Commerce Department said Tuesday.
Rebounding from near-collapse in the spring, retail spending has improved since the summer, even topping pre-pandemic levels. In October, overall retail sales were up 5.7% compared with a year earlier.
That +5.7% year-over-year gain rises to +7.4% when gasoline is excluded. (The fact that people aren't buying gas is a good thing, which actually gets counted as a subtraction when included in the overall number.) The graph on the right is a picture-perfect illustration of what is meant by a V-shaped recovery: two months down and only 2 months up to make it all back, then back to business-as-usual-sized increases after that.
Just as I quibbled five week's ago with NPR's use of the inaccurate "had inched up," I have to do the same now with the choice of "barely budged" (which is also part of their URL headline). If a number like this (a) has already recovered 100% of its "near collapse," (b) is now 5.7% above Oct 2019's full-prosperity numbers, and (c) is still rising, it take a special kind of editorial judgment (should I call it "bias"?) to characterize a 0.3% un-annualized monthly gain as "barely budged."
Briefly, the construction industry continues to be very hot:
New-home construction surges to post-Great Recession high in October, driven by rise in single-family starts
U.S. builders started construction on homes at a seasonally-adjusted annual rate of 1.53 million in October, representing a 4.9% increase from the previous month’s figure, the U.S. Census Bureau reported Wednesday. …
The housing starts report follows yesterday’s release of the November home builder confidence index from the National Association of Home Builders. The index inched higher for the fourth consecutive month, demonstrating the upbeat outlook in the construction industry.
Indeed, virtually every home builder is seeing rising sales as Americans look to leave urban areas for larger homes in the suburbs only to find very few existing homes up for sale.
But builders naturally face roadblocks as they attempt to ramp up the pace of production. There’s only so much skilled labor to go around, and the availability of buildable lots and supplies also puts constraints on the speed with which they can construct new homes.
The next day, the National Association of Realtors added information about the sales of existing homes:
Existing-home sales continued to trend upward in October, marking five consecutive months of month-over-month gains, according to the National Association of Realtors®. All four major regions reported both month-over-month and year-over-year growth, with the Midwest experiencing the greatest monthly increases.
Total existing-home sales, https://www.nar.realtor/existing-home-sales, completed transactions that include single-family homes, townhomes, condominiums and co-ops, increased 4.3% from September to a seasonally-adjusted annual rate of 6.85 million in October. Overall, sales rose year-over-year, up 26.6% from a year ago (5.41 million in October 2019).
That puts existing-home sales at a 14-year high, with realtors looking for continued low mortgage rates and booming sales through next year at least.
Here is the promised rather wonky coda about the railroad traffic data that powered this week's NY Fed's WEIndex to a small increase. The Association of American Railroads, sort of a data-heavy industry trade group, gathers and reports the numbers. Their website explains, sensibly:
Since demand for rail service arises as a result of demand elsewhere in the economy for the products that railroads haul, rail traffic is a useful gauge of broader economic activity, both for specific industries and for the economy as a whole.
And their Nov 18 press release includes:
For this week, total U.S. weekly rail traffic was 527,462 carloads and intermodal units, up 5.2 percent compared with the same week last year.
Total carloads for the week ending November 14 were 232,146 carloads, down 3.1 percent compared with the same week in 2019, while U.S. weekly intermodal volume was 295,316 containers and trailers, up 12.9 percent compared to 2019.
Total combined U.S. traffic for the first 46 weeks of 2020 was 21,734,299 carloads and intermodal units, a decrease of 8.8 percent compared to last year.
Aar.org's Rail Traffic Data page shows the weekly numbers for 2018-2020.
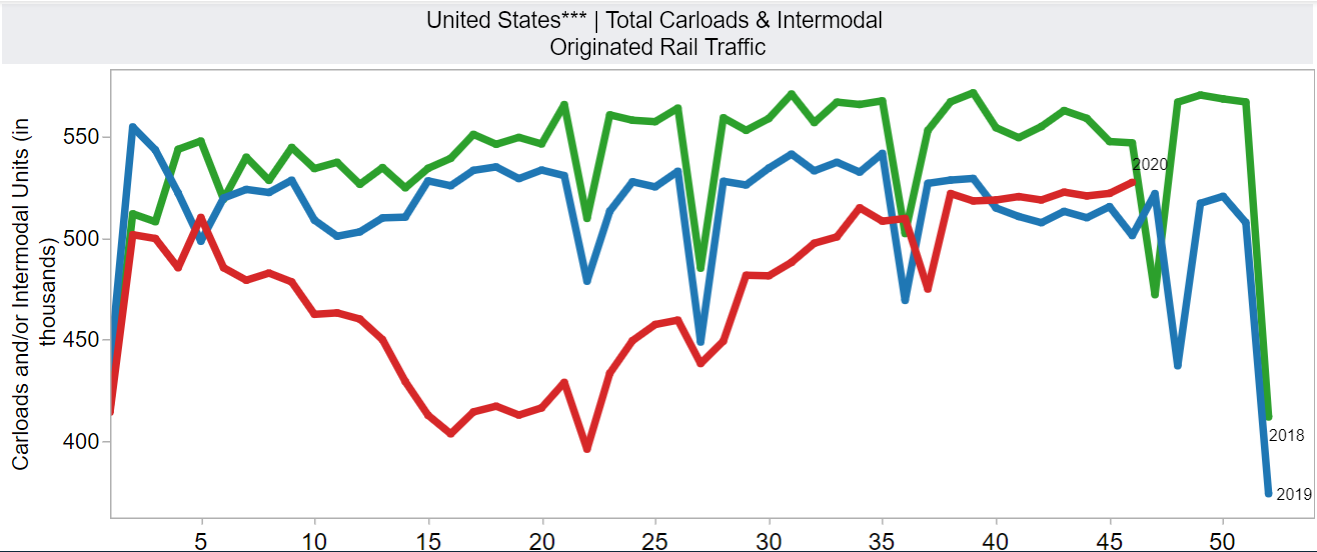
The red line is this year. We can see that the data are not seasonally adjusted: hence the dips every Memorial Day, Independence Day, Labor Day, Thanksgiving, and New Year week. Not being seasonally adjusted makes the display of the two previous years especially important. I wouldn't have guessed that 2019 ran below 2018 almost every week of the year by often 5-10%, but it did.
More importantly and interestingly, 2020 also started lower and then started falling in the sixth week of the year, in February. We think of the national shutdown as having kicked in during the second week of March or the weekend of March 14-15, which would be around week 10 or 11 on this graph. But we can see that those weeks were in the middle of a drop that had started a month earlier, which reinforces the point I remember making in the first of these newsletters nine weeks ago: the economy [i.e., all of us a consumers, producers, savers, investors, employers, employees, etc.] was ahead of any sort of political policymakers responding to the virus.
More importantly than that, rail traffic has been at its highest point of the year every week since Labor Day, and has been higher than last year every week since a little later in September, although still below the 2018 levels, which were all-time highs. My conclusion is that the recovery = 100% of the COVID crash for this one of ten indicators important enough for the NY Fed to watch closely every week.
Another graph from aar.org shows the same data in one time series and smoothed from weekly to monthly data:
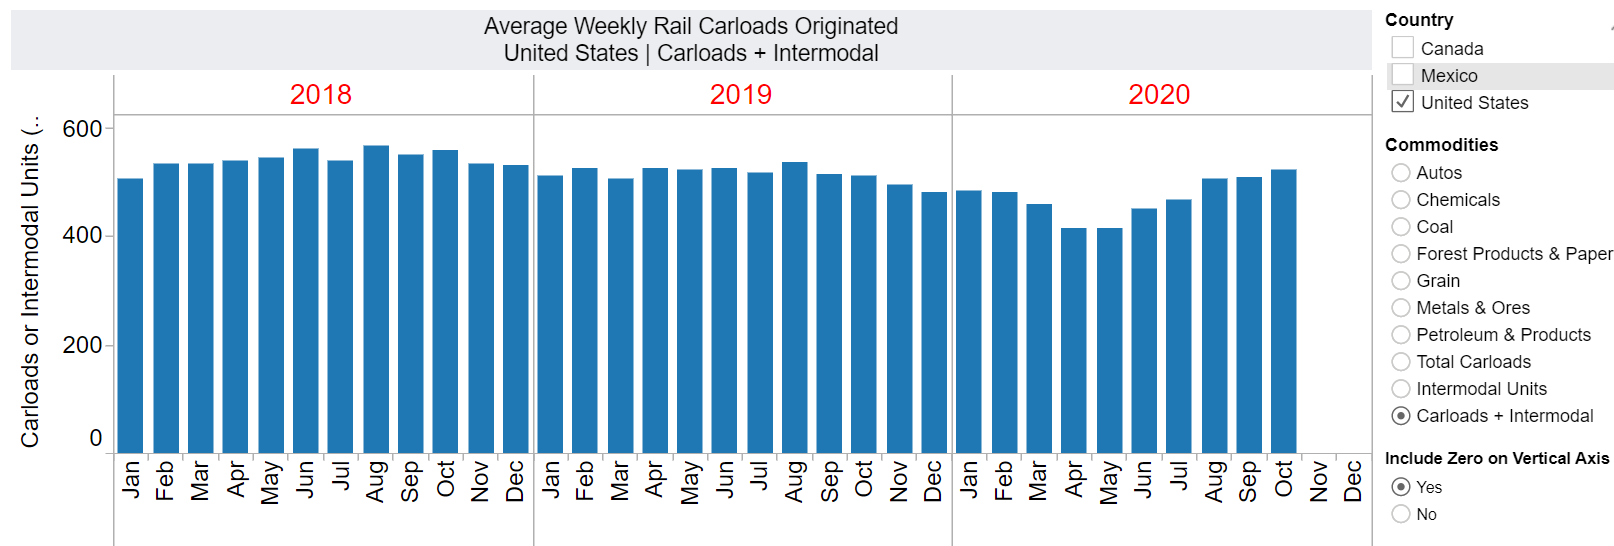
Aside from confirming what I just said about the recovery reaching 100% of pre-COVID levels during the 3rd quarter, this view also informs and reinforces my argument (which took a lot of ink last week) against Mauldin's view that the recovery hit a plateau and stopped in July. No, the improvement, at least in rail traffic, continued into September, at which point it was basically at full strength. Then, as we saw at the top with the WEI data, the last week was up another 5.5%.