By the time I finished writing this weekend, I realized that the data pointed me to this conclusion:
COVID has stopped being a catastrophe for the economy at large, or for the "underlying" structure of the economy. Evidence indicates that the core of the economy is intact, is growing where and when it can (but being slammed by COVID in [only] the sectors where it makes sense that it would be), and is ready to resume full strength when COVID pressures relent. That will likely strike some as counterintuitive or flatly wrong-headed, but I believe that if you read this newsletter thoroughly and follow the thread all the way through, you could come to the same conclusion. Without one-sidedly looking only for evidence that supports a pre-conceived notion, what I see is evidence that leads me here.
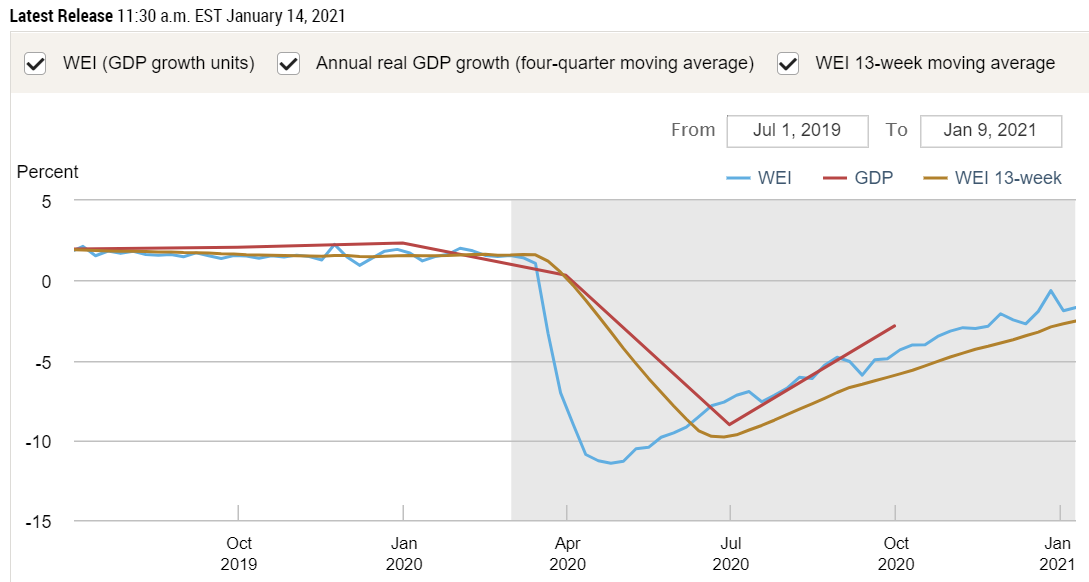
Since I last checked in with this index two weeks ago, the Dec 26 number was revised significantly upward, and then the next reading came in lower—thus creating the little spike you see near the right end of the blue line. Then the last data point came in higher at -1.70%.
What does any of this mean? The short answer is that it means fourth-quarter Oct-Dec GDP is probably going to be about 1-2% below the same number in pre-COVID Q4 2019. By contrast, actual Apr-Jun Q2 GDP had fallen 9.03% from one year earlier, and Jul-Sep Q3 GDP was -2.85% below 2019's Q3. The index is a composite of 10 high-frequency daily and weekly stats, five of which are cited in the Fed researchers' only paragraph of Commentary for the latest week:
The increase in the WEI for the week of January 9 is due to rises in tax withholding, fuel sales, and rail traffic, which more than offset an increase in initial unemployment insurance claims and a decrease in electricity output (relative to the same time last year).
GDP is, of course, the summation of all spending on marketable final goods and services throughout the economy; for all its measurement faults it does track as closely as any indicator ever invented with what we wish to be measuring: our standard of living [economically, if not spiritually, culturally, etc.]. We'll get the first official estimate of Q4 GDP from the Bureau of Economic Analysis on Jan 28, but we know that it will show continued progress in the Q4 following a historically huge rebound in Q3 (following the catastrophe of Q2). WEI tells us that Q4 will still be below one year earlier, but not by a lot.
Last week I ended limply by referring you to these two articles about the December employment report of Jan 8, without offering further comment.
My headline had even emphasized the bad news on unemployment. I knew and acknowledged at the time that my week-ago newsletter was far from my best effort, but I dropped the ball by not going deeper into those numbers. That's really what I should be doing here. [Somehow, last week's newsletter ended up receiving my highest circulation and engagement statistics of any week yet; and that even though I did not announce the posting on Facebook, for once. Why would it be that my weakest effort gets the most traction?] I'll make up for it now:
One obvious thing to look for with employment reports is the revisions to the previous two months that accompany each new month's stats. Recall that the headline number Oct+Nov revisions were +135K, meaning that the Dec number for total national payrolls was only -5000 below what we had thought the Nov number was. Five thousand is—not exaggerating—rounding error out of a labor force of 160 million.
So the payroll jobs number was essentially flat on a revisions-adjusted basis. The COVID shutdowns imposed large drops in the bars/restaurants (-372K) and entertainment/recreation (-92K) industries—i.e. those most reliant on interpersonal interactions with large numbers of strangers, and therefore most susceptible to disruption by fiat shutdowns or by fear.
But that means all other employment sectors, the non-COVID-susceptible ones, actually gained hundreds of thousands of jobs in Dec, a lot more than negligible. Here, U. of Oregon professor Tim Duy blogs about the rest of the story, and also adds more interesting detail from the Wall Street Journal and a nice graph (all emphasis in Duy's original):
The employment report was the highlight of the week, disappointing markets with a somewhat weaker than expected 140k job loss. I am going to take an unpopular position on this report: It was actually a strong report given the circumstances and reveals the underlying resilience of the economy.
We need to look beyond the headlines on this. Unsurprisingly, leisure and hospitality accounted for the bulk of the decline with the sector loosing 498k employees. We know, however, exactly what is happening in this industry and what is going to happen after vaccines are widely distributed: It’s going to bounce back quickly. The other challenged sector is government which shed 45k jobs in December and roughly 1.3 million since the pandemic began with the largest part of that weakness in education. While it is often assumed that funding issues primarily account for the reduction in education employment, you should also consider other factors. Notably, in a Zoom-classroom world, schools need only a fraction of the usual number of substitutes. [SL: I would add janitorial staff and bus drivers and probably others like maybe nurses, physical trainers, etc.] In addition, teachers have taken voluntary leaves of absences during the pandemic. When schools reopen, both categories of teachers will bounce back, as well as the ancillary staff. In short, this problem will largely correct itself (watch though for schools to face a teacher shortage as some of the pandemic-impacted employees will certainly drift into other occupations).
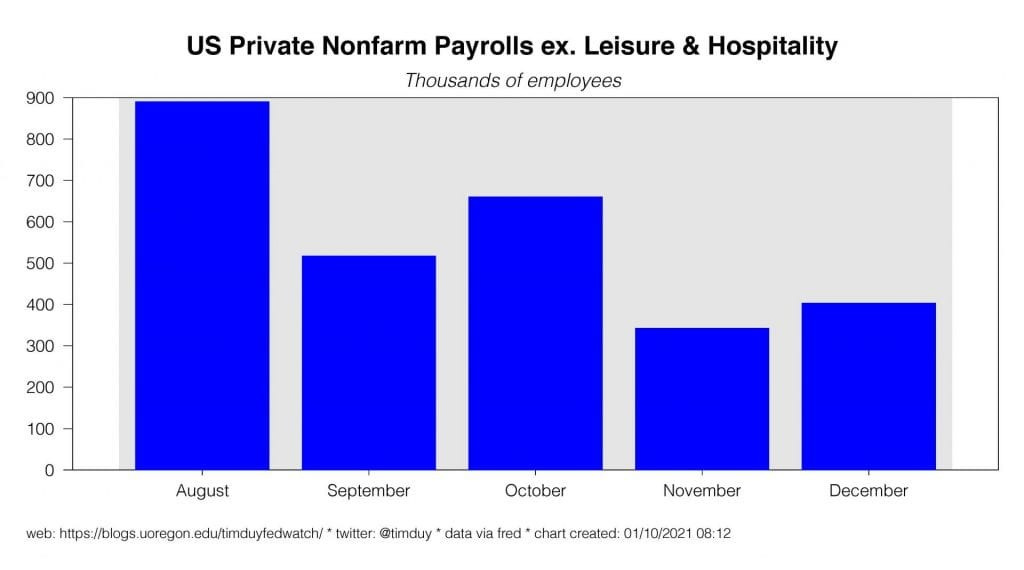
What does the picture look like outside of those sectors? The private sector excluding leisure and hospitality gained 403k jobs last month during the winter wave of the pandemic:
The three-month average growth rate was 468k. That growth rate alone – assuming no acceleration! – means 5.6 million jobs in 2021 not counting any bounce back in leisure and hospitality or education. The key point: Don’t use the three-month moving average of the headline number of 283k and extrapolate out to gauge expected job growth this year. That approach yields a way too pessimistic forecast.
American manufacturers have gotten better at safeguarding their factory floors and containing infections of Covid-19 in their workforces. Despite the progress, they are still struggling to find enough people to staff their plants. The worker shortages are choking supply chains and delaying delivery of everything from car parts to candles just as demand is picking up…
… Companies are taking extraordinary measures to keep their lines running. At a Wisconsin dairy plant, managers have been asking employees to cancel vacation and the company recently asked a maintenance worker to help make cheese. An Ohio auto-parts maker advertised jobs on city buses and is considering adding a graveyard shift for working parents. A generator maker is so backed up on orders due to absenteeism that it has raised starting pay 25%.
There is a lot happening underneath the surface of the economy. This is not like the last expansion. Don’t let anyone tell you it is.
Thank you Prof. Duy. I would add to the WSJournal's anecdotes one of my own: A few weeks ago I received a piece of mass-mail in the form of a postcard from a local manufacturing firm soliciting job applicants. When's the last time you got a mailing from some company (other than the Census Bureau, once every decade) inviting you to go work there?
I'll also add that the WSJournal's final anecdote about raising starting pay by 25% is just one of a whole set of factors converging on an increase in inflation expectations, imminently in my view. I repeat what I wrote two weeks ago, namely that I hope and expect to focus more extensively on the inflation story soon.
Inflation is one of the issues asked about by the Federal Reserve Bank of New York every month in their Survey of Consumer Expectations. In my recent Dec 20 issue, I devoted over 1200 words to looking rather carefully at their findings for Nov. Now four weeks later, they are out with Jan numbers, none of which diverge very strongly nor interestingly from before. Even their own little write-up sounds rather uninspired or mailed-in, as if they had little to say. Repeating that none of the details below are of even close to major moves, I still list them mostly just to be complete in my reporting. Looking through all of the data in the Jan survey and comparing it to Dec, I find these survey topics yielding results you'd call Worse:
inflation expectations (both 1-year & 3-year ahead; especially for respondents over age 60)
probability of losing job (Note: this was offset by "probability of leaving job voluntarily" also rising, which I consider to be a sign of positive confidence in the labor market)
probability of finding a job in the next three months if lose job today
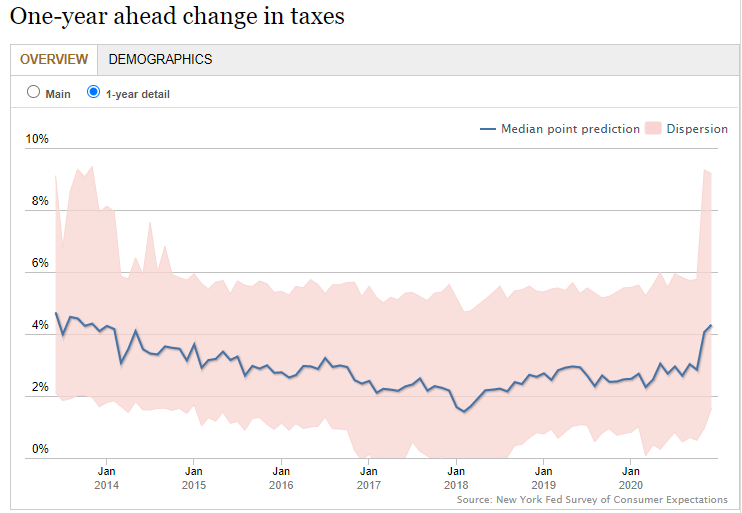
one-year ahead change in taxes (rose sharply in Nov, then again in Dec, suddenly back to levels last seen the first year of the survey, 2013; the graph is here and below)
household financial situation: financially worse off than one year ago
one-year ahead government debt growth expectations
And I find these topics looking Better in Dec:
probability that U.S. unemployment will be lower one year from now
one-year ahead household income growth expectations
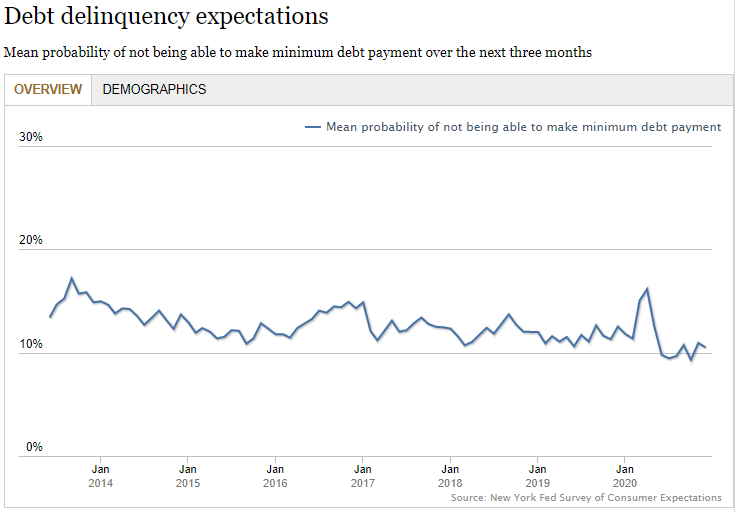
probability of not being able to make minimum debt payment over the next three months
household financial situation: expect to be financially better off one year from now
Regarding that second-to-last bit about missing minimum debt payments, I repeat what is true for every one-month move in both lists above: the change was too minor to justify major conclusions. But the graph of the whole 2013-present time series tells a story starkly at odds with what we hear in the impressionistic media environment that doesn't trouble us with too many specifics.
Each of the last 7 months in this survey has turned up record-low or essentially-tied-for-record-low numbers of Americans believing themselves soon to be unable to pay a debt—around 10%. (That's going back to the origination of the survey in 2013.) I don't know how to square that with what I read about a coming wave of evictions and foreclosures. Is it that people are confident about their debt payments because they don't expect to have to pay a different major expense, rent, as long as eviction moratoria are in place? That would be one way to explain it, but I just don't know.
Speaking of what consumers are feeling or thinking, Friday Jan 15 saw the release of the University of Michigan's consumer sentiment index. Read this report and graph from Reuters news service to see why I'm going to stop paying attention to this particular survey after this last time:
Even as the survey’s overall reading of sentiment dipped modestly, it plummeted to a six-and-a-half-year low among Republicans while surging to a four-year high among Democrats. …
The magnitude of the swing in expectations by party affiliation in the last six months of 2016 and 2020 were nearly identical at around 74 points, [Chief Economist] Curtin noted.
“The partisan gaps are rooted in sharply different policy preferences, with one side favoring economic growth and efficiency, and the other side giving top priority to greater equity and fairness in the distribution of income and wealth.”
I've reported the same thing at least twice in previous months, and it's no longer interesting to point out that people of each party form their views/expectations of the economy—at least in this UMich survey—based largely on their partisan rooting interests. It's only interesting to see that the very same thing happened four years ago, in reverse: "mirror image," as the caption says. If that is most of what this survey is capturing and reflecting, then it's not worth my time to look it up nor to write about it.
I did, however, find one additional nugget worth relaying from the Reuters story, again quoting economist Richard Curtin:
On COVID-19, the survey found some optimism around the nascent rollout of vaccines as helping limit the decline in overall sentiment. “Importantly, COVID’s threats to physical and mental health were seen in January as more important than its financial repercussions.”
I think that is really the theme of this week's newsletter, especially the part above about employment: COVID has for several months, probably starting in the summer, stopped being a catastrophe for the economy at large, or for the "underlying" structure of the economy (to quote from a headline referenced above).
The same theme can be discerned in the two other major monthly indicators released on the same day, Friday. Although they offer contrary pieces of evidence about the retail and industrial/manufacturing sectors of the economy, they both provide evidence that the "underlying" economy is intact, growing where and when it can, and ready to be at full strength when the COVID "pressures" relent.
WASHINGTON (Reuters) - U.S. retail sales fell for a third straight month in December as renewed measures to slow the spread of COVID-19 triggered job losses, further evidence that the wounded economy lost considerable speed at the end of 2020.
The downturn in sales reported by the Commerce Department on Friday is, however, unlikely to push the economy back into recession, with other data showing production at factories accelerating last month.
“That should make Congress more willing to deal on Biden’s wish list,” said Steven Blitz, chief U.S. economist at TS Lombard in New York. “Critical to Biden’s story is that the virus itself is creating the downturn, not any fundamental problems with the economy, and this is what needs to be done to address it.”
Retail sales dropped 0.7% last month. Data for November was revised down to show sales tumbling 1.4% instead of 1.1% as previously reported. Sales rose 2.9% on a year-on-year basis.
The monthly decline in sales was led by a 4.5% plunge at restaurants and bars after many authorities banned indoor dining over the holiday season. Online sales tumbled 5.8%. Receipts at electronics and appliance stores dropped 4.9%.
Consumers also cut back spending at sporting goods, hobby, musical instrument and book stores as well as beverage stores. That offset a 1.9% rebound in sales at auto dealerships and a 2.4% increase in receipts at clothing stores. There were also gains in sales at building material stores as well as health and personal care outlets.
In a third report on Friday, the Federal Reserve said manufacturing production rose 0.9% last month after advancing 0.8% in November. That was the eighth straight monthly gain in factory production. Manufacturing is being supported by a shift in demand towards goods from services.
Production at factories increased at a 11.2% rate in the fourth quarter.
“Manufacturing is clearly weathering this wave of confirmed COVID-19 cases better than occurred earlier this year,” said Ryan Sweet, a senior economist at Moody’s Analytics in West Chester, Pennsylvania. “Manufacturers are busy, as there is a need to rebuild inventories and demand for consumer goods remains strong, for now.”
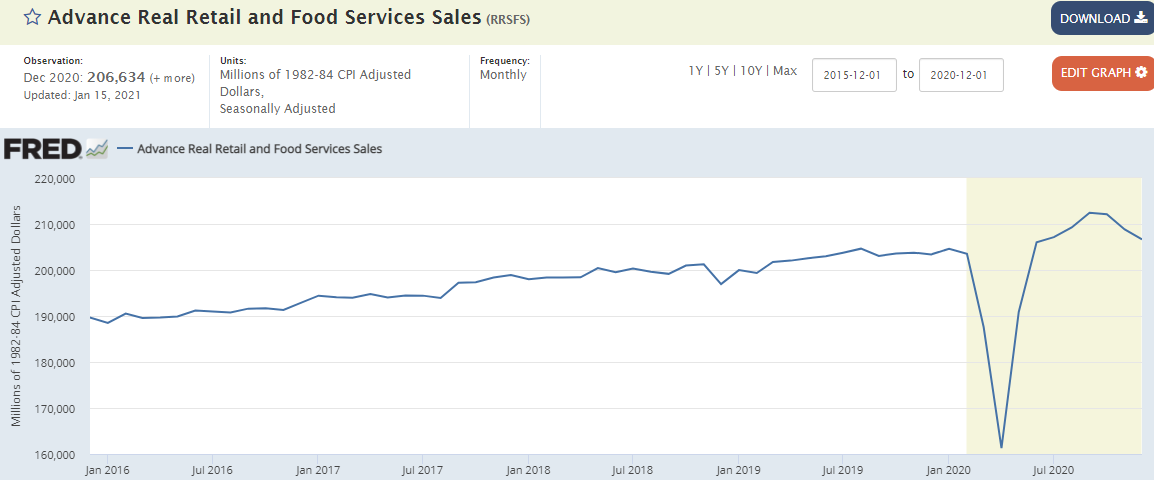
See the one sentence I italicized because it was so easy to overlook: "Sales rose 2.9% on a year-on-year basis." I have written before that, by last June, retail sales had already recovered to be above 2019 levels, which also means record highs. Even with the last three months of declines, it's still true that we're above the levels of 2019 or any prior year ever. Here from the publicly accessible FRED database and graphing tool provided by the Federal Reserve Bank of St. Louis is a depiction of our sharply V-shaped retail recession. I'm showing the adjusted-for-inflation version for the last five years.
And I'll end with a couple clarifying notes about the aforementioned industrial production data, beyond what Reuters said:
"Industrial" includes the output of factories, mines, and utilities, with factories forming the large majority of the total (around 85%, going by what I knew when I worked closely with these numbers in my first career as a macroeconomic forecaster, 30+ years ago).
The 0.9% Dec increase reported above for factory output came in at almost double the median 0.5% guesspectation of economists. The strength extended across both subdivisions of consumer goods (+1.6%) and business equipment (+0.6%). The percentages are month-to-month, not yet annualized.
Factory output has risen every month since the COVID catastrophe in the spring (although September's rise was as small as could be at +0.1%).
Contrary to what happened with retail sales (but similar to what happened with employment, above), the revisions to Oct and Nov data were in the upward direction. That leaves overall Q4 performance at an impressive +8.4% (annualized) overall and +11.2% for the factories component.