For national economic statistical indicators, at least, it was a sleepy week of Jan 18 - 22.
On Thursday U.S. Census Bureau and the U.S. Department of Housing and Urban Development jointly announced new residential construction statistics for December 2020, and the media reported it this way:
Building Permits in December rose 4.5% above November's revised level and is 17.3% above the December 2019 rate of 1,457,000. The gain was concentrated, unsurprisingly, in single-family homes, up 7.8% for the month, seasonally adjusted. Considering the full year's aggregate numbers, 2020's 1,452,000 new housing units authorized by building permits came in 4.8% above 2019.
Permits are a "double-leading" indicator in the sense that they occur and are counted before construction can begin. Housing starts are themselves a leading indicator that anticipates later downstream economic activity, such as the purchase, per se, of the house and all the furnishing and such that happens in the couple years after construction Starts. Permits anticipate all of this spending and earning and working by even more time.
The same government report tells us about Starts: December came in 5.8% above November's revised number and 5.2% above Dec 2019. As was true with permits, the positive action is in single-family housing, up 12.0% for the month, rather than in densely-packed apartment projects. Annually, an estimated 1,380,300 housing units were started in 2020; this is 7.0 percent above the 2019 figure. Given that permits have been running consistently above starts, all of this augurs very well for continued strength in housing construction, employment, and further downstream good news in 2021 and possibly beyond.
Also on Thursday Jan 21 we heard from the Philadelphia branch of the Federal Reserve about their monthly Business Manufacturing Outlook Survey. The news was straight-up positive for the mid-Atlantic region—overall and in every included detail. Quoting almost all of their announcement, starting from the top (adding italics for emphasis to three sentences/clauses):
Manufacturing activity in the region continued to grow, according to firms responding to the January Manufacturing Business Outlook Survey. The survey’s current indicators for general activity, new orders, and shipments increased notably this month and remained positive for the eighth consecutive month. The survey’s future indexes remained at high readings and continue to indicate that firms expect growth over the next six months.
Current Indicators Are Positive and Higher
The diffusion index for current activity increased from a revised reading of 9.1 in December to 26.5 (see Chart 1). The percentage of firms reporting increases this month (40 percent) exceeded the percentage reporting decreases (13 percent). The index for new orders increased 28 points to a reading of 30.0, its highest reading in three months. Over 45 percent of the firms reported increases in new orders this month. The current shipments index increased 11 points to 22.7 in January.
On balance, more firms reported increases in manufacturing employment this month. The current employment index has remained positive for seven consecutive months and increased 17 points to 22.5 in January. Employment increases were reported by 33 percent of the firms, while 10 percent reported decreases. The average workweek index was also positive for the seventh consecutive month and edged 3 points higher to 18.6.
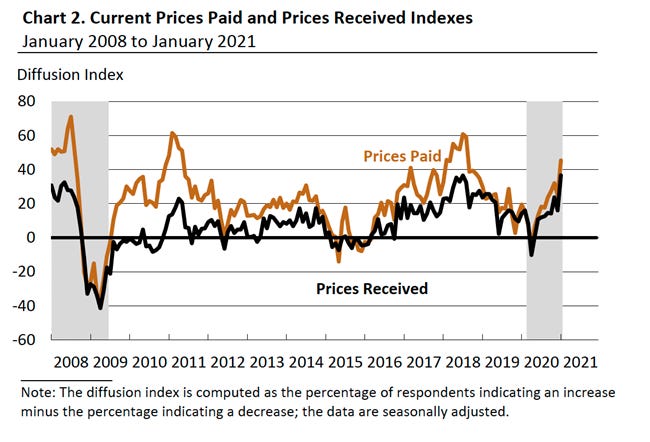
Price Indicators Increase This Month
Price increases were more widely reported this month. The prices paid diffusion index increased 21 points to 45.4 (see Chart 2). Over 47 percent of the firms reported increases in input prices, while only 2 percent reported decreases. The current prices received index, reflecting manufacturers’ own prices, also increased 21 points to 36.6. Over 38 percent of the firms reported increases in prices of their own manufactured goods, while 2 percent reported declines. The largest percentage of firms (60 percent) reported no change in prices for their manufactured goods.
Firms Expect to Increase Production in the Near Term
In the Special Questions this month, the firms were asked to characterize demand for their products over the past few months and to forecast their production for the first quarter of the year (see Special Questions on page 3). Most firms (64 percent) reported an increase in underlying demand, but 18 percent characterized underlying demand as decreasing in recent months. Over 69 percent of the firms anticipate increasing production in the first quarter, while 24 percent expect decreases. Among the firms expecting an increase in production, 51 percent indicated that this would be accomplished with additional workers. Most of the remaining firms indicated higher production would be accomplished without additional hiring: Nearly 23 percent would increase the hours of existing workers, and 20 percent indicated production could be increased with higher productivity of existing workers.
Firms Continue to Expect Growth
The survey’s indicators for future general activity improved this month, and although other future indicators declined somewhat, they remained at elevated readings. The diffusion index for general activity over the next six months increased 10 points, from a revised reading of 43.1 to 52.8 in January (see Chart 1). The percentage of firms expecting growth over the next six months (64 percent) remained significantly greater than the percentage expecting declines (12 percent). The future new orders index held steady at an elevated reading of 47.5, and the future shipments index decreased 2 points to 46.1 this month. The future employment index fell 2 points: Over 44 percent of the firms expect to increase employment in their manufacturing plants over the next six months. The future capital spending index showed notable improvement, increasing 12 points to 35.4.
I decided to include the part about price inflation as part of a multi-week tease of my intention to write more about all the sources of inflationary pressure I see in the economy. I think this is the third consecutive week in which the issue has arisen, and this one is a very specific, quantified clue that my general impression-under-construction is correct.
The only other indicator released last week was the one on Friday from the National Association of Realtors about existing home sales, forming a complement to the Census/HUD news about new home starts and permits at the top of this newsletter. NAR's headline is "Existing-Home Sales Rise 0.7% in December, Annual Sales See Highest Level Since 2006," again invoking the same "highest since 2006" headline as we saw above. Each of the four regions of the country recorded double-digit year-over-year growth in December, with the national average coming in at +22.2%. By the way, these are not estimates. They are the known, counted transactions that occurred last year, compiled from the paperwork people do when they 'close' on a house purchase.
NAR's chief economist mimics my assessment above: "What's even better is that this momentum is likely to carry into the new year, with more buyers expected to enter the market. Although mortgage rates are projected to increase, they will continue to hover near record lows at around 3%." (But if I am right about inflation, mortgage rates could rise higher than that, and sooner than most expect.)
After seeing Thursday's news, the GDPNow 'nowcasters' at the Federal Reserve Bank of Atlanta, whose work I have described in most of these newsletters since at least November, revised their "running estimate of real GDP growth based on available economic data" for the fourth quarter. The official number (first estimate, anyway) comes out from the Bureau of Economic Analysis on Thursday, but for now the running estimate stands at +7.5%, annualized. The Thursday housing and Philly manufacturing news being good, that's an increase from the previous +7.4%.
Not all econometric modelers believe the number will be that high (following the third quarter's +33.4% and a Q2 drop of almost the same percentage), with one headline-generating estimate running at 4.1%. At its peak in early December, GDPNow's running estimate was 11.2%, but some sectors of the economy have softened since then.
I first heard of Atlanta's GDPNow by doing this newsletter project in Q3, when it turned out that GDPNow was both more optimistic and more accurate than were the bulk of other forecasters. We shall see Thursday whether the same holds true in Q4. The Atlanta Fed has one update scheduled for Wed, giving them that one chance to zero in on Thursday's actual number.
That's it for the week's economic indicators. I almost decided to give up on this week, since I've been overly burdened at my day job and desired a break. I also considered redirecting the newsletter toward a lament about the seeming impossibility of finding straight information about what is going on outside of the realm I cover here. For example, is anyone out there writing seriously about Pres. Biden's 30 executive orders over a three-day period? What do they mean for the economy or for whatever? The national evening news broadcasts are useless: >10% of their 21 minutes spent teasing stories; >10% on the final feel-good story; ABC spending 10% of every night showing pictures of where there is wind or rain or snow something, as if we don't know already what that looks like. That leaves about 14 minutes, which most nights they spend a lot of showing us what full hospitals look like, what lines for vaccination or testing look like, what tired nurses look like, what grieving families look like—but almost entirely free of information that I didn't already know as of about April. There's almost no time for telling us about things that have actually happened.
For example, Sunday night, NBC started a story by saying, "Tonight, for the first time in months, COVID numbers are trending downward," then went on to contradict that assertion with vague and fragmentary anecdotal data from Illinois ("daily new cases decreased by a third in the last two weeks"), New York, and California, the upshot of which is confusing and takes careful re-viewing and discerning listening to figure out. Indeed, checking with the authoritative and famous Johns Hopkins "Dashboard" site and clicking around a little, I found this graph, showing that U.S. cases peaked in the first days of January and have been trending downward ever since. So the downward trend nationwide started about two and a half weeks ago, not "tonight, for the first time."
And NBC spent their time confusing us about the COVID case trend instead of reporting on things that have actually happened, such as new policies and rules emanating out of Washington that affect us and that we as citizens are supposed to be informed about (and as subjects we are supposed to be obeying).
I challenge you to watch the Nightly Evening World News Tonight and make a list of the facts that you learned about events that happened today or recently. Then re-watch the same show and make a list of the attitudes or general impressions that an alert viewer can tell that the anchor/reporters/editors/corporation wants us to internalize and come away with. My contentions are (1) that the second list will be substantially longer than the first; and (2) that this tells us what the news is for, in the present environment.
Another example: I'm quite sure that every night for a week or more, except possibly the day of the inauguration, I've heard on the network news a lot of time spent talking about the COVID mutations, but in all that time and talk I'm quite sure I haven't heard any new information that I didn't already know in December. So, if no facts/learned/events/happened, what's the point beyond the general impression of the variants?
In this and in so many ways, I have been spending a lot of my time wishing I had more options for true, useful news. I invite you to leave recommendations in the comments.