


Mixed Economic News and Perceptions This Week
But the data are better than you probably think (or have heard)

Key points:
IHS Markit survey sees "steeper upturn in output," "marked rise in new orders," "steepest monthly rise in employment," "improving demand environment," "greatest degree of optimism for the year ahead since May 2014."
GDP watchers at Atlanta Fed Bank double outlook for fourth-quarter growth—now expecting double digits.
Durable goods orders and shipments grew in October; so did consumer spending and a measure of personal incomes.
However: four surveys of consumers all show increasing pessimism.
Initial claims for unemployment insurance rose both of the last two weeks amid investigations of "tremendous amounts" of fraud.
The mixed news begins again with the Weekly Economic Index compiled by the Federal Reserve Bank of New York. The headline says the index increased, showing a further improvement in conditions. But the increase was from a week-earlier number that had been revised down to show a drop that week, contrary to what we thought a week ago. The same sort of downward revision had also happened one week ago, to the prior week's number.
The net effect of all of this is to show that the index is still trending upward, but at a weaker pace than in Sep and Oct, and including a step backward a week ago. Specifically, the last 4 data points are -3.18, -2.96, -3.00, and -2.83, meaning that it's looking like 4th quarter GDP this year will be about 2.83% lower than the same quarter in 2019. At the worst point in April, the number was -11.45%. Because the ten broad-based and highly timely daily and weekly indicators in this composite number are so comprehensive of the whole economy, I will continue to track it closely.
Last week I arranged my several reports in order from gloomy to optimistic. This week I reverse that order because the most optimistic of them is also the most interesting. It comes from IHS Markit, the current incarnation of my old economic-modeling-&-forecasting employer of 30 years ago. During November 12-20, they compiled data for their Purchasing Managers' Index (PMI). To further explain, I'll just quote the entire main section plus the summarizing Commentary from their Nov 23 press release, entitled Recovery gains further momentum with hiring at all-time high:
U.S. private sector business activity rose sharply in November, as growth momentum picked up further. The overall expansion was the fastest for over five and-a-half years, as both manufacturers and service providers indicated a steeper upturn in output. The month also saw a survey record rise in employment and an unprecedented increase in prices, the latter in part linked to a record incidence of supply chain delays.
Adjusted for seasonal factors, the IHS Markit Flash U.S. Composite PMI Output Index posted 57.9 in November, up from 56.3 in October. The rate of growth was the sharpest since March 2015, as a steep upturn in service sector activity was accompanied by an accelerated rise in manufacturing production.
As well as a sharp increase in business activity, companies reported a marked rise in new orders during November. The rate of growth was the fastest since June 2018, with a substantial acceleration in manufacturing new business growth to a 30-month high boosting total sales, joined by the quickest rise in service sector sales for 26 months. The increase in total orders was largely driven by domestic demand, as both goods producers and service providers indicated only marginal upturns in new export business.
Encouragingly, there was a marked uptick in hiring during November to result in the steepest monthly rise in employment recorded since the survey began in 2009. Service providers boosted their workforce numbers amid burgeoning demand, but hiring slowed slightly in manufacturing.
The improving demand environment allowed increasing numbers of firms to raise their selling prices, with November consequently seeing the quickest rise in prices yet recorded by the survey. The rate of inflation hit a record high in the service sector and a 25-month high in manufacturing.
Firms also registered an unprecedented rise in input costs during November, as growing demand for inputs and supply shortages reportedly pushed supplier prices higher. Service sector cost inflation hit a survey high and manufacturers’ input costs rose at the sharpest rate for just over two years, with supplier delays more widespread than at any other time in the survey’s 11-year history.
Improved hopes of a vaccine against the coronavirus disease 2019 (COVID-19), and an end to election uncertainty, led to the greatest degree of optimism for the year ahead since May 2014.
Commenting on the flash PMI data, Chris Williamson, Chief Business Economist at IHS Markit, said:
The November PMI surveys provide the first postelection snapshot of the US economy, and makes for very encouraging reading, though stronger economic growth is quite literally coming at a price.
First the good news: business activity across both manufacturing and services rose in November at the strongest rate since March 2015. The upturn reflected a further strengthening of demand, which in turn encouraged firms to take on staff at a rate not previously seen since the survey began in 2009.
However, the surge in demand and hiring has pushed prices and wages higher. Average selling prices for goods and services rose at the fastest rate yet recorded by the survey, with shortages of supplies also more widespread than at any time previously reported.
Firms are scrambling for inputs and workers to meet the recent growth of demand, and to meet rising future workloads. Expectations about the year ahead have surged to the most optimistic for over six years, reflecting the combination of a post-election lift to confidence and encouraging news that vaccines may allow a return to more normal business conditions in the not too distant future.
I am struck by how remarkably exuberant this report is about both the recent past and the foreseeable future. The London-based firm that compiled the data and wrote about them has no particular ax to grind. Think about the news you get from all of your combined media sources: what is the general impression you get about the economy? If it differs very much from the above, you might want to ask yourself, "What axes do my media sources have to grind?"
If you have been wondering, "Why is the stock market up seemingly every day this fall when all I hear is how bad economic conditions are?" maybe it's time to flip that query around and ask instead: "Why am I being told only how bad economic conditions are when impartial observers, people who work full-time in the financial industry, and objective data have been so overwhelmingly positive for over six months now?"
Gross Domestic Product (GDP) is the most general measure of overall economic activity. It is measured quarterly and updated with revisions monthly. You very likely missed the non-news that the end-of-Nov update of end-of-Oct's 3rd quarter GDP came in with zero revision. So the record-breaking +33.1% annual rate of growth in July-Sept holds.
Then, the Atlanta branch of the Federal Reserve keeps track of "a running estimate of real GDP growth based on available economic data for the current measured quarter." They call it GDPNow, a 'nowcast,' different from a forecast. When they first attempted to guess Q4 GDP on Oct 30, their number was +2.2% (annualized rate of growth). As they watched new economic data emerge in November, almost always on the rosy side of estimates (exactly as chronicled in these weekly newsletters), they bumped up their Q4 percent estimate into the 3s. Then, when they saw the all-good numbers I wrote about last week, they bumped up 3 more times:
Nov 17 industrial production up 1.1% (un-annualized), GDPNow up to 5.4%
Nov 18 housing starts up 4.9%, GDPNow up to 5.6%
Nov 19 existing home sales up 4.3%, GDPNow up to 6.0%
Then, check what happened this week:

The new news that caused the Atlanta Fed to raise their nowcast for the current quarter's GDP to 11.0%, far above the range of all previous estimates, was the raft of data dumped by several government agencies on Wednesday the 25th, what I call Thanksgeen. The most significant among these seems to have been the Census Bureau's data on new orders for and shipments of durable goods. Both were up 1.3% (un-annualized) in October; that's the sixth consecutive monthly increase for orders and the fifth increase in six for shipments. Both September numbers were also revised upward from the previously reported increases, so the news was all good, and significantly above expectations. Since orders in particular is a leading indicator, signaling further good news in the coming months, the Atlanta Fed thought this was significant enough to move their GDPNow nowcast materially upward.
The Atlanta Fed might also have been partially motivated by some of the news accompanying the non-event I mentioned above—the non-revision of Q3 GDP. That report comes with monthly detail about personal income and personal expenditures. The first impression you would glean from media sources and from the press release from the Bureau of Labor Statistics is probably not a cause for celebration, but a look at the details casts the news in a more favorable light.
The various aid packages put into effect early in the year have skewed the numbers for personal income: first boosting it with, for example, $1200 'free' money, and then creating the artifact of an apparent drop in income when that money ran out. But if we smooth things out by excluding transfer receipts or "welfare" of various sorts, October personal income rose 0.78% and is up 2.2% year-over-year (i.e., from Oct 2019). After adjusting for inflation the year-over-year is up 1.0%. These are the sorts of numbers we would often see in a typical good year from the past decade, which makes this another sign that the fundamentals of the economy—the foundation underneath the COVID disruptions—are sound and almost (dare I say it?) normal. Or at least ready to return to a type of normal once the vaccines allow a cessation to the shutdowns.
Also from the monthly GDP detail report is the fact that personal consumption expenditures continued to increase in October. It was up 0.5%, unannualized. That was the slowest rate of increase of the six-month-long rise, but the Atlanta Fed may have been expecting worse, contributing to their sudden adjustment of GDPNow's Q4 guesspectation from 6.0% to 11.0% in a single day.
One last number that influenced the GDPNow revision was the Thanksgeen news from the Census Bureau that sales of new residences dropped very slightly from the high levels reached this summer and fall. From the official report:
Sales of new single-family houses in October 2020 were at a seasonally adjusted annual rate of 999,000, according to estimates released jointly today by the U.S. Census Bureau and the Department of Housing and Urban Development. This is 0.3 percent (±13.6 percent)* below the revised September rate of 1,002,000, but is 41.5 percent (±22.6 percent) above the October 2019 estimate of 706,000.

University of Oregon economist Tim Duy commented on his blog, "Housing is traditionally a solid leading indicator and talk of a double-dip recession is wildly inconsistent with the strength the sector continues to exhibit."
On the less optimistic side of the ledger were several measures of consumer confidence or sentiment.
First, the Conference Board reported this that their Consumer Confidence Index® was revised up in October to a value of 101.4, and then fell in November to 96.1. (Being above or below 100 is not significant, as the data series is arbitrarily indexed to 100 being the value in a random year (1985). Both the Present Situation Index and the Expectations Index participated in the decline. A group called Morning Consult surveys consumer confidence separately, and they reported the same findings on the same day (last Tuesday).
Marketwatch.com reports on last week's third simultaneous measure of consumer sentiment:
The second and final reading of the consumer sentiment index from the University of Michigan fell to 76.9 in November from an initial 77 earlier in the month and 81.8 in October. Economists polled by MarketWatch had forecast the index to slip to 76.8.
By a variety of measures consumers turned more pessimistic this month owing to a record spike in coronavirus cases that has led some states to reimpose business restrictions and limit gatherings in public. …
For the first time in four years, meanwhile, Democrats are more optimistic than Republicans and are likely to become even more so after the election of Joe Biden as president. Republicans have lost confidence since the defeat of President Trump.
Even the joy of political victory, however, has not been enough to buoy the spirits of Democrats even further in light of the latest viral outbreak.
Big picture: Consumers are less optimistic about the economy, but most businesses are already looking toward next year and the possibility of coronavirus vaccines being widely available. That’s helping to keep the economy on a steady growth path.
And Forbes magazine/website provides another measure of consumers' mood, the Forbes Advisor-Ipsos U.S. Consumer Confidence Weekly Tracker, using data gathered between Oct 28 and Nov 12. The results are also gloomy:

See the big drop in the green Jobs Confidence number from last year; for context, at its COVID low in early April, jobs confidence bottomed out at 47.4.
Consumers form over two-thirds of the entire economy, so our expectations of bad times can become self-fulfilling. Obviously these consumers have not been paying attention to the exuberance of IHS Markit and the GDPNow nowcast.
Our last economic indicator is the widely watched initial claims for unemployment insurance that normally comes out on Thursdays. This is one of the ten components of the Weekly Economic Index that I led off with again this week, so in a sense we have already covered it. But here is full coverage from The Week, citing several other sources:
The number of Americans filing new jobless claims has once again risen and come in higher than expected.
The Labor Department on Wednesday said 778,000 Americans filed new jobless claims last week, up 30,000 from the week prior. This was higher than the 733,000 claims economists had been expecting, CNBC reports.
Last week, the number of new jobless claims had also risen by about 31,000 claims, more than economists anticipated. After the latest uptick in claims reported on Wednesday, Bloomberg reports this was the "first back-to-back increase since July."
New cases of COVID-19 have been climbing in the United States, which has prompted numerous states to implement new restrictions, and the increase in jobless claims was a "sign the nationwide surge in virus cases was starting to weigh on the labor-market recovery," The Wall Street Journal writes.
Here, for full context, are the weekly data (in thousands) since just before the onset of the COVID crash:

I'd summarize the recent months this way: initial claims were around/above 1 million a week in most of August; in the 800,000s in September (and the last week of August); and in the 700,000s in October and November, with no lasting improvement since the first week of October.
I've seen some mentions of big problems with these numbers, along the lines of many more people claiming insurance than statisticians can find of lost jobs; but I haven't independently investigated those. A quick search turns up lots of fraud activity at the state level, like these headlines from Google News:
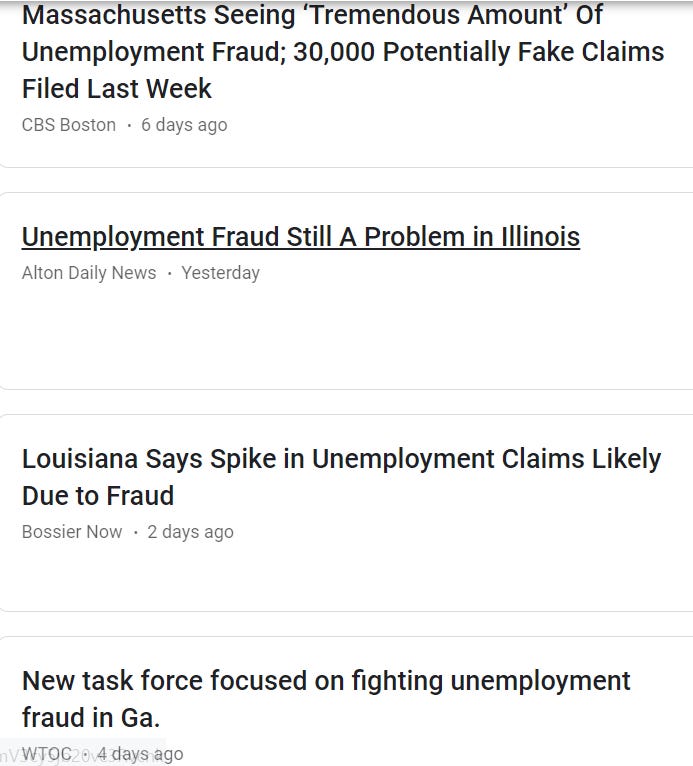
Other states making similar headlines in very recent days (but not able to fit into the screenshot) included California, Michigan, New York, and Washington. The case of the notorious inmate Scott Peterson among California fraud cases attracted the attention this week of even the New York Times. The headline from NBC News read "Scott Peterson, thousands of California inmates carried out 'staggering' Covid fraud, officials say." I just don't know how much cases like that account for the continuing high number of unemployment claims, but the top headline's 30,000 in one week in one state suggests that the table of initial claims numbers needs to be marked with an asterisk.
All in all we have a big split in perceptions. Economists who survey businesses, carefully watch the numbers as they are released, and run them through analytical tools are almost giddy with optimism about the near future and beyond. (For more on that, see Prof. Duy's previous blog post, which is so interesting that I have meant to build a whole separate newsletter around it.) On the other hand, consumers at large are turning markedly more pessimistic just during this month. So far, most empirical measures of actual activity have been positive and indeed surprising on the upside rather consistently ~ and that has been true not just this month, but every month since May; the downers have been responses to surveys about expectations and sentiment.
Whether the real economy continues outperform by shaking off the skittishness of consumers—or whether consumers' fears self-fulfill into a deceleration or worse—is the question to watch in December and beyond.