Forecasts from May in Tatters
Forecasts from May in Tatters
Economy far outperforms expectations

Key Points:
—> Fivethirtyeight.com's panel of forecasters saw depression conditions enduring well into 2021
—> We now expect real GDP growth of 30-35% in third quarter of 2020
—> September unemployment has already fallen to half of what was predicted
—> Congressional Budget Office forecast also erred wildly in the pessimistic direction, compared to actual economic performance
—> Even ultra-pessimistic commentator John Mauldin now sees “green shoots”
To gain some wider perspective on the course of the recovery from the COVID recession of 2020, consider the baseline predictions of a curated set of 31 "quantitative macroeconomic researchers who work in academic settings," gathered by a research center at the University of Chicago and fivethirtyeight.com. Published on May 26 based on a survey taken over the preceding four days, these data reveal predictions that are so far from the actual economic performance over the five months since then, that I am a little surprised that this site is still so easy to find online.
My point is not to point gloating fingers at these economists ("Look how ridiculously wrong they were!"), but rather to establish a baseline of what things looked like at the end of spring and compare that to how things have actually happened. That, then, allows us to make the judgment—I'll just say it outright instead of pretending there is any suspense or spoiler factor at work here—that the U.S. economy has performed remarkably well since May, much better than the best-informed professionals dared to predict.
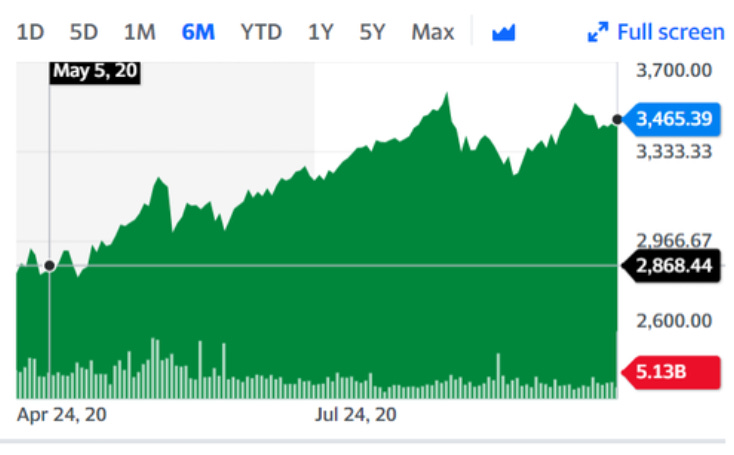
It's worth pointing out that [1] at the time the predictions were formed, the major COVID models were saying the final, cumulative number of U.S. deaths would be in the mid 100,000s. (I remember specifically on May 5 when I heard that the one major University of Washington model raised its final total sharply to 135,000, and I thought that sounded horrific and hit the Panic Sell button on a bunch of mutual funds, thus locking myself out of the 20.8% stock price appreciation since then. As I always say, "Predictions are hard, particularly those concerning the future.")
[A graph showing the last 6 months of the Standard & Poors stock index is at the bottom of the article. That's because Substack uses the first image of an article as its thumbnail, and the next image makes for a better thumbnail.]
And it's worth pointing out that [2] this study was published on the very day before Memorial Day—that is, George Floyd day—such that no one could foresee the destruction and re-shuttering of many American business districts for reasons even apart from COVID. And [3] I'd venture to say that these economists probably also expected further Congressional action beyond the three multi-trillion-dollar bills quickly passed in March, if only an extension of those programs such as the Paycheck Protection Program. But no further legislation has yet been forthcoming (even as the AM radio news update reports on further talks in Washington at this hour). The commonality in these three factors is that two major negative hits and the absence of one expected positive shock occurred after the study, which should have made the economists' May predictions too optimistic for three distinct reasons.
When asked in the fivethirtyeight.com survey which quarter of the year would be the first one to show positive real GDP growth, the economists’ answers were:
54% July-Sept 2020 (Q3)
23% Oct-Dec 2020 (Q4)
22% Jan-Mar 2021 or later
Thursday October 29 is the day when we will get the word that Q3 GDP did rise, and not by a close-call small amount. The Atlanta branch of the Federal Reserve publishes what they call GDPNow, which they describe as "a running estimate of real GDP growth based on available economic data for the current measured quarter." That means they at the Atlanta Fed watch the unfolding of daily indicators a bit like I do but much more closely, and adjust their estimates for the next GDP report on an almost daily basis.
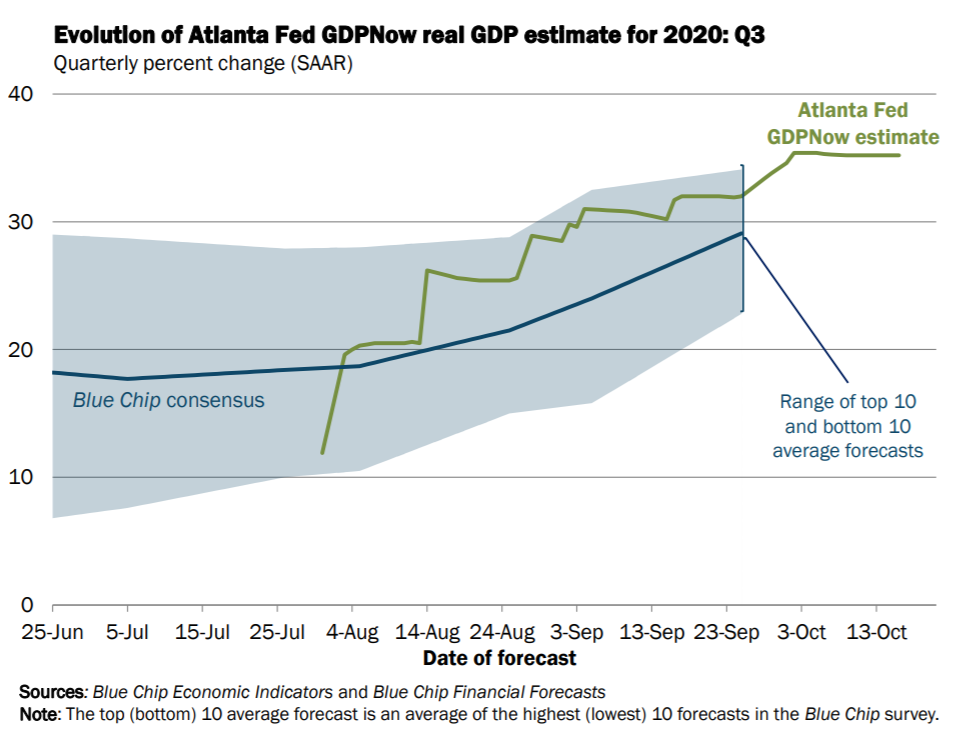
As you can see, since they began their guesspectations for Q3 on July 31, they have raised it in numerous steps from 11.9% SAAR [seasonally-adjusted annual rate] to 35.3% as of the most recent adjustment on Oct 20. Their guesspectation converged near 35% at the beginning of October and has stayed there all month, which has the effect of removing most suspense from next Thursday's official GDP release.
A number in the 30s like that is phenomenally high, way above any other quarter ever, or ever imagined. The 31.4% annualized drop in the second quarter was similarly science-fiction-level unprecedented. But to think that 45 or 46% of the economists polled in May figured that Q3, and for half of those the fourth quarter as well, would drop further and that we would not see even the beginning of any kind of recovery until right about now or quite a bit later than now—well, those 45-46% were very spectacularly wrong. Or, the more charitable view that I said I would focus on: as of May, the remainder of the year looked a lot more dark than it has turned out to be, now that 5 of the 7 remaining months have occurred.
We see the same result in the economists' responses to every other question they were asked. (No cherry picking here.) Using the 4th quarter 2019 as the baseline for "what it was" or "pre-crisis level," here's one question and their answers:
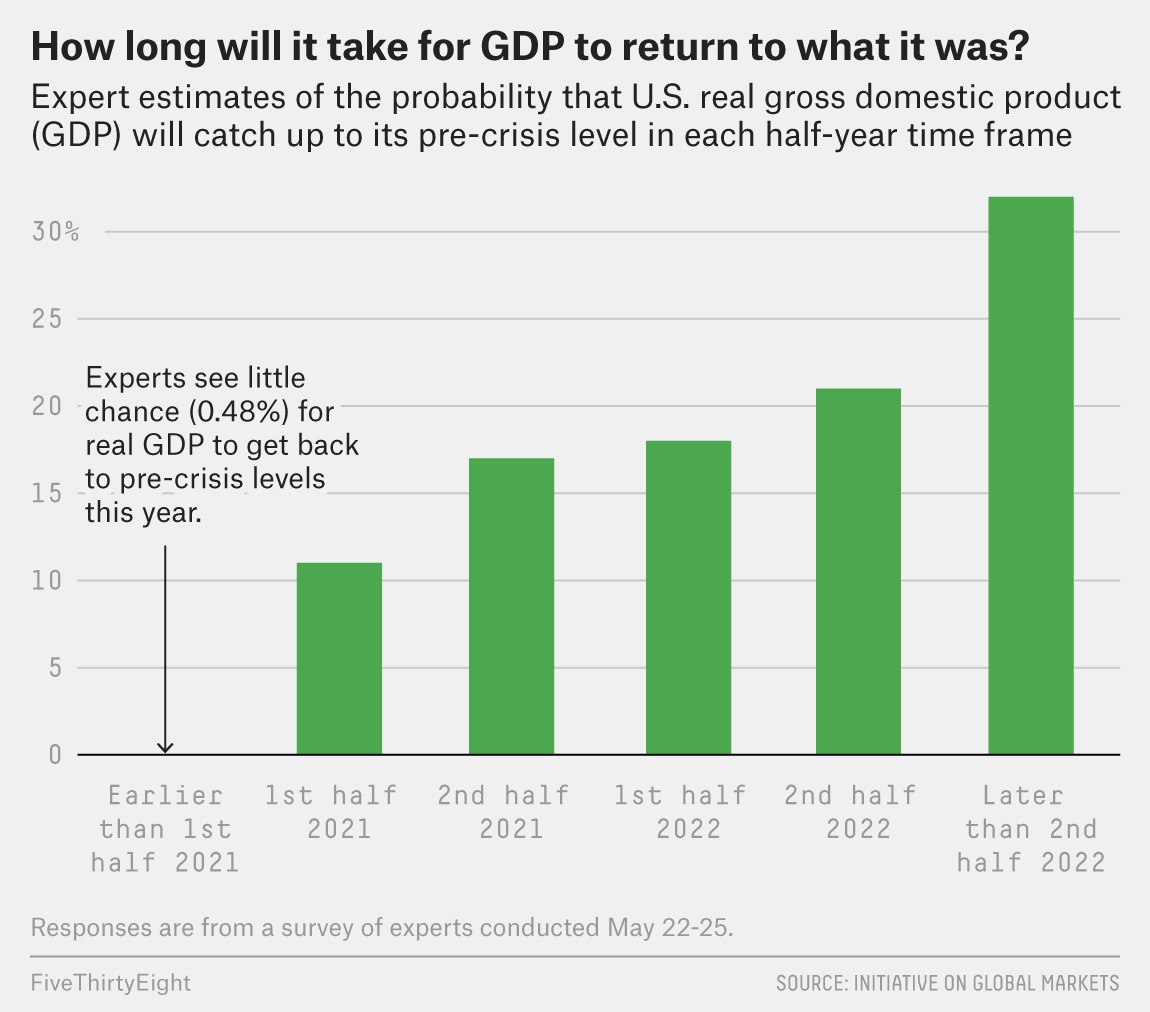
Next weekend, after the release of the Q3 data, I can quickly calculate the rate of GDP growth needed in Q4 to bring about a within-2020-V-shaped recovery. This outcome was thought by the experts to be wildly optimistic in May, at a probability of only 0.48%, essentially zero. In my next article, I'll let you know my own subjective probability.
The other five green bars above can be read this way: in May our best forecasters picked July 2022 as the most likely timing of the complete recovery of GDP: 46% probability before July 1, 2022, and 53% after that date. We now think it will happen year or a year and a half earlier.
Turning to unemployment:

The unemployment rate peaked in April below 15% and then fell for five months and counting. As for the rate falling below 10%, that almost happened in July, and then decisively did happen in August (8.4%) before falling again in September (7.9%). The 8% probability of seeing unemployment below ten percent in Q3 came true.
Graphed against a different set of projections from the Congressional Budget Office, made almost simultaneously with the fivethirtyeight.com survey, here's what the unemployment data look like:
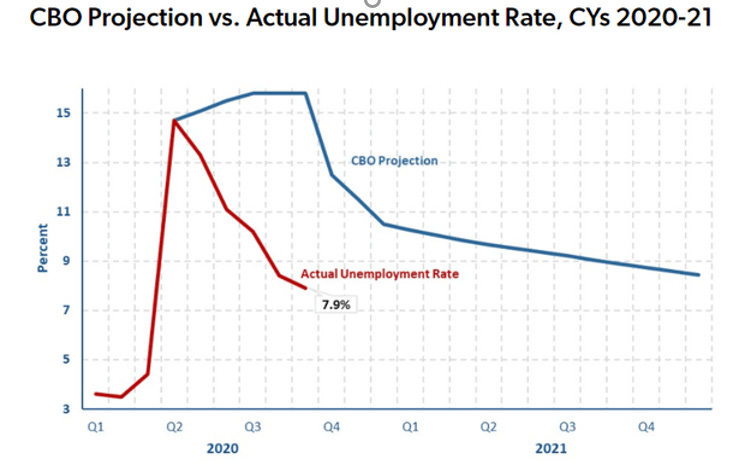
[CBO Projection data from Table 1 of the Congressional Budget Office's "Interim Economic Projections for 2020 and 2021" issued in May 2020; Actual Unemployment Rate from the U.S. Department of Labor.]
Note that unemployment is already lower/better than the CBO predicted it would be at the end of next year. It took 4 months from April to August—not 20 months until Dec '21—to get that degree of improvement. Another startling way of putting it is this: Unemployment now is half the level that gov't economists thought in May that it would be now. The recovery is proceeding at a rate that is several times faster than the best guessers were guessing in the spring.
The next graphic shows the full breakdown of 31 economists' forecasts for unemployment at the end of this year, including both a point estimate and a confidence interval for each expert.
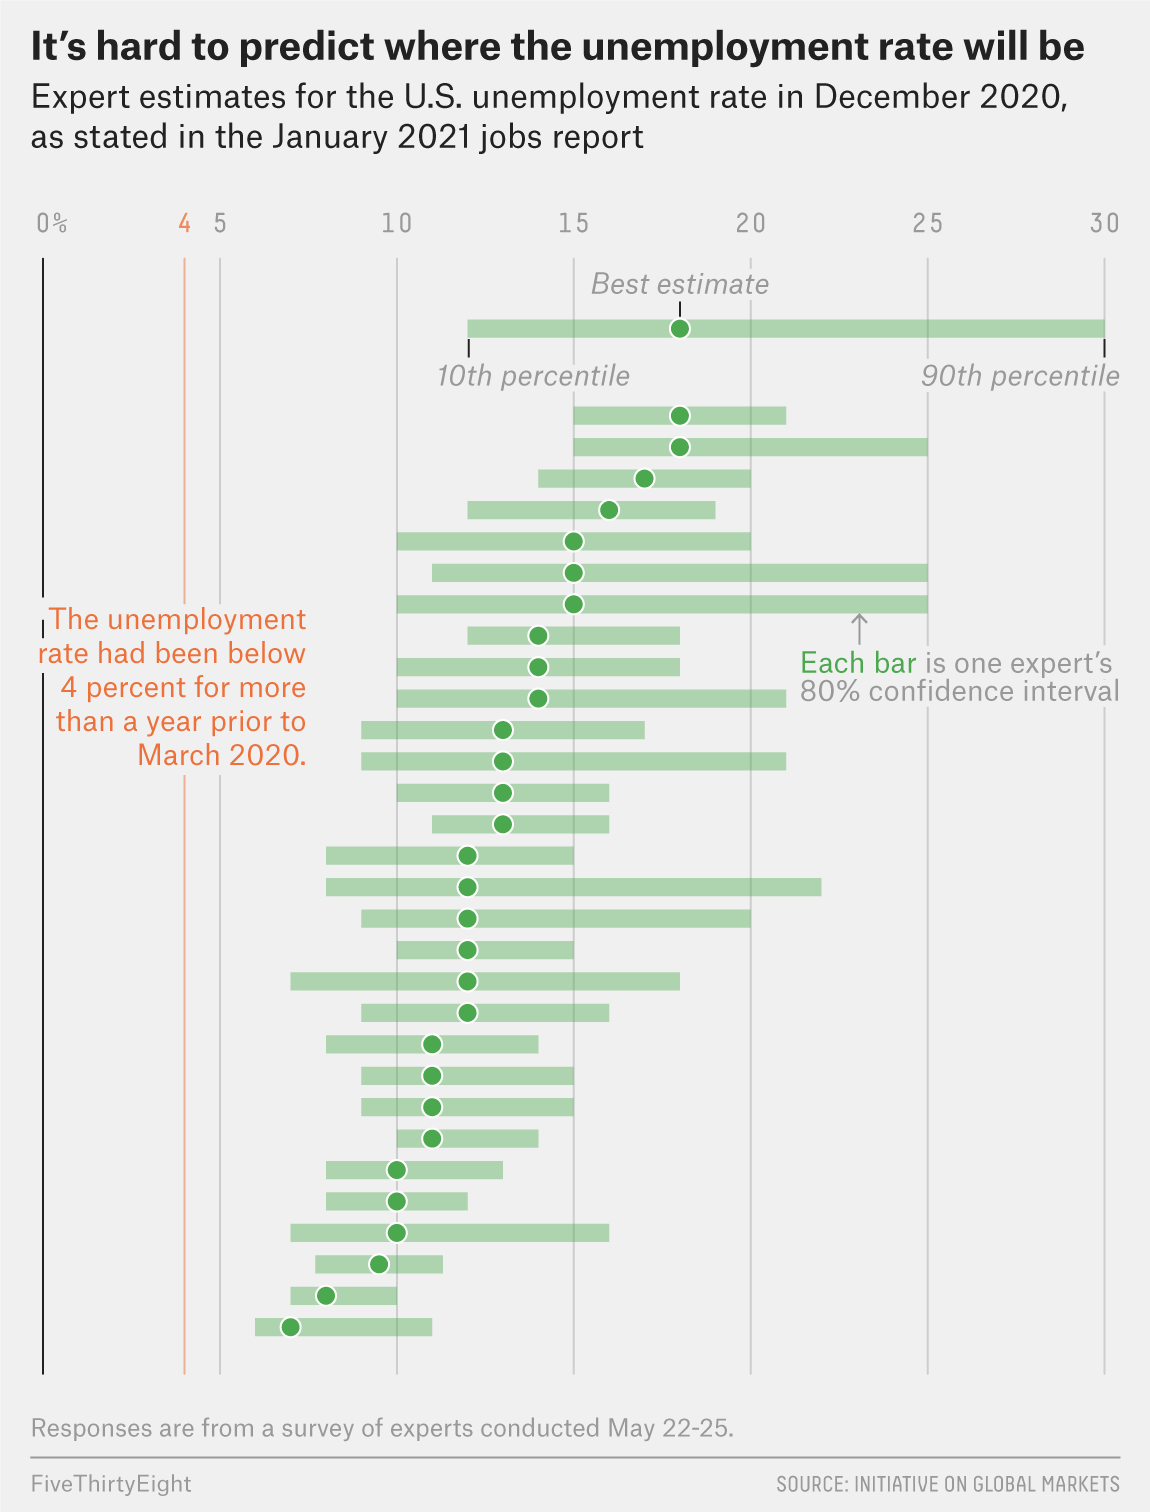
Of the 31 quantitative macroeconomic researcher/experts:
1 thought unemployment could be as high as 30% in December
8 gave their best guess as 15% or worse, and 2/3 included >15% inside their confidence interval
the median (and mode) estimate was 12%
only 2 placed their point estimate below 9.5%
only 1 was sure the December rate would be below 10%
For perspective, the peak unemployment rate during the 2008-09 Great Recession / Global Financial Crisis was 10%. These people predominantly thought we would remain in much worse shape than that through all of this year and beyond.
By now it is evident that this is nowhere near true. Assuming we don't suffer a complete "double dip" recession in the next two months (and I am willing to make that assumption), the unemployment number released on the first Friday of January 2021 will show that the single most optimistic of the 31 economists—the one who projected a range of 6 - 11%—will be proven to be most accurate, and maybe only barely optimistic enough.
Every week my in-box hears from a variety of economics commentators. Some are of the "it's always sunny" variety, and some are completely on the pessimistic side. I value them all, and my attempts to reconcile these valued but contradictory messages or to form my own impression without taking any of these people's word for it has led to this current writing project. Very far on the gloomy side recently has been John Mauldin, who has been in the econ/financial newsletter business for a long time. In his latest installment, he acknowledges some reasons for optimism for the first time since March:
[Y]ou can look around today’s economy and see green shoots here and there. As bad as things are—and make no mistake, they’re bad—we’ve regained some lost ground since the March/April depths. But the problem is in the “here and there” part. Some parts of the economy are literally booming even as others are in a deep, dark depression.
That’s kind of where we are. If you are in the right spot, you see whole forests of green shoots. You might think they are growing everywhere. And in due course maybe they will, but for now, a significant number of people just have dirt.
Later in the same newsletter, Mauldin adds a couple of especially interesting paragraphs emphasizing the flexible and dynamic nature of American capitalism, which continually confounds those who use static assumptions in making predictions:
We are seeing an increase for the first time in a long time of new business startups. I keep trying to emphasize over the last few months that the very entrepreneurs whose 100,000+ businesses had to be closed (with thousands more coming) won’t just sit on the porch. They have an entrepreneurial gene in their DNA that almost forces them to launch new businesses. They can’t help it. And we are seeing it in the data.
Another interesting development: People are switching jobs and careers at an unprecedented level. USA Today has a fascinating story on people switching careers. When you realize your job will probably not come back, you adapt. We are finally seeing more people being willing to move outside their local areas to where the jobs are.
Mauldin also called my attention to this graph showing another picture of the depth of the recession, the substantial recovery so far, and three different possible paths from here. The graph and three projections are courtesy of the Conference Board. Their index is not GDP nor any particular indicator, but rather a proprietary composite index that they put together.
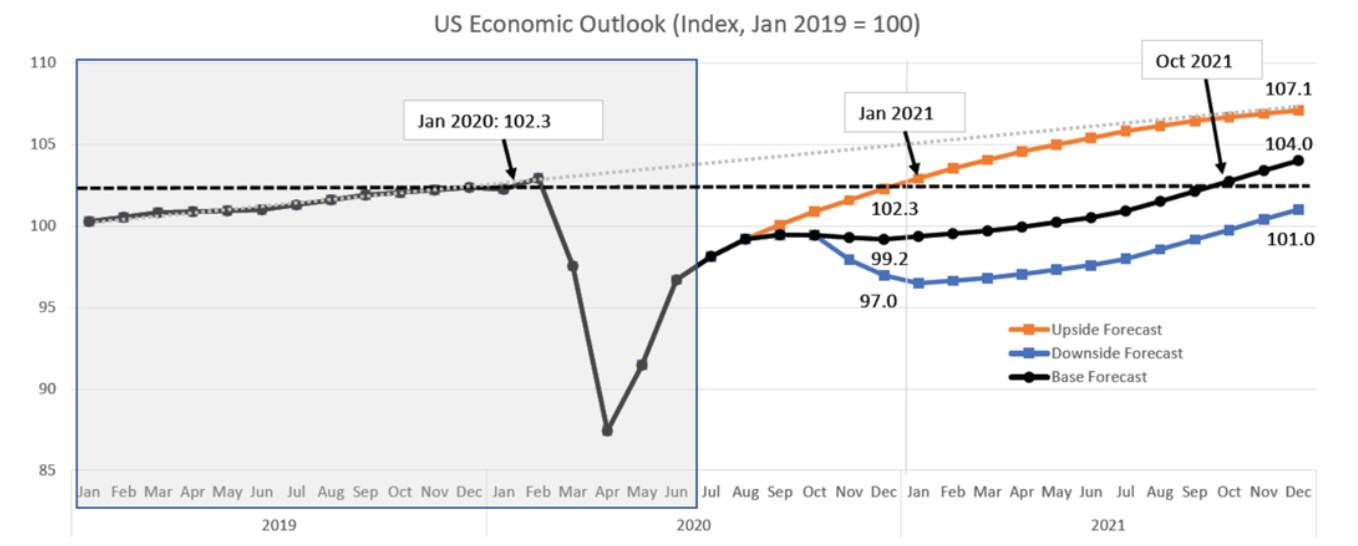
Stay tuned for updates of the macroeconomic data every weekend as I continue my project of applying my analytical skills to finding, presenting, and interpreting the constant onrush of statistics about the state of the U.S. economy. It will be fascinating to see whether any of the Conference Board's orange, black, or blue forecast lines bear any relation to what happens this winter and beyond. My purposes remain descriptive (of what we know), not predictive (of what we don't).
Finally, as a postscript, this is the graph showing the 20.8% stock market run-up missed by anyone who thought May 5 was a good day to sell: